by Hans Erren
published online 7 may 2012
Abstract
A remarkable periodicity in the Mauna Loa Carbon Dioxide observations makes it possible to forecast the lower tropospheric temperature twentyfive years ahead. Using the carbon dioxide thermometer of Jarl Ahlbeck, a major El Nino is forecast in 2013 and a “Super El Nino” of 0.66 degrees in 2023.
History
In 1999 the Carbon Dioxide Thermometer was discovered and described by Jarl Ahlbeck on the website of John Daly. Jarl Ahlbeck discovered a remarkable temperature effect in the annual CO2 increase in Mauna Loa. The effect was so striking that he coined it the Carbon Dioxide Thermometer, link1, link2
estimated LT MSU = Carbon Dioxide Thermometer = 0.23*(dCO2 – 1.53) ± 0.2°C
Where dCO2 is the moving annual increase of CO2 at Mauna Loa.
13 years later it is is still showing proof of it’s validity as an independent benchmark of the satellite temperature.

Calculatated temperature based on Mauna Loa data (blue), observed temperature anomaly (red), note the El Chichon eruption in 1982 has limited effect on CO2 but a profound effect on temperature, perhaps due to the location of El Chichon to the east of Hawaii. The effect of the Pinatubo eruption in 1991 is clearly visible in both records.
(Click in the image for fullscale pdf download)
A discovery
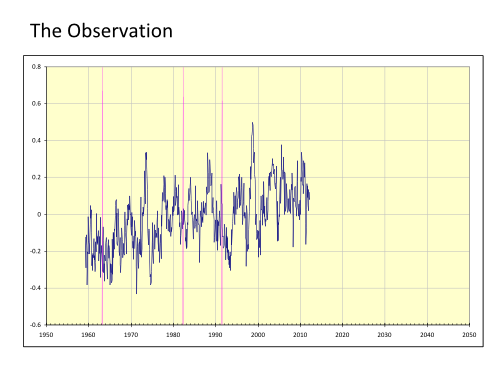
(Click in the image for fullscale pdf download)
Above is the whole dataset stretching backwards to 1958, looking at it recently, a feature struck me, which I hadn’t noticed before: The super El Nino of 1973 has a strong resemblance with the El Nino of 1998. It becomes even more apparent if we put the sequences on top of each other:
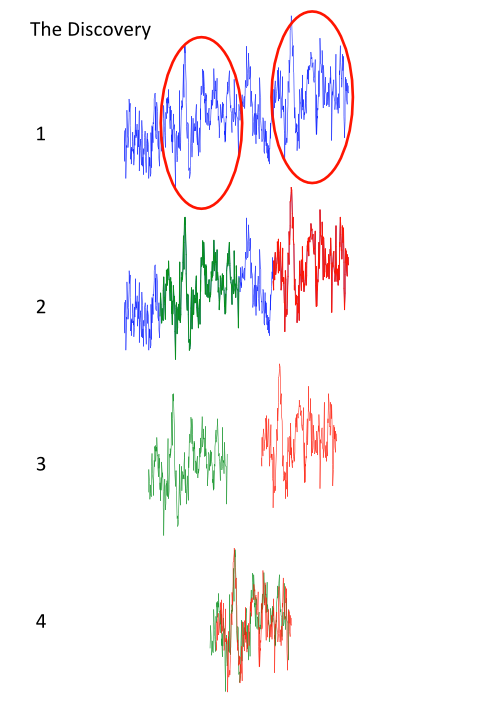
1. Blue: Observation 2. Red: El Nino 1998, Green: El Nino 1973 3. The time series singled out 4. The time series overlain.
(Click in the image for fullscale pdf download)
-
The Lower troposphere temperature has a periodicity which can be expressed in the following formula:
(where Tlt is temperature anomaly of the lower troposphere in degrees and t is time in years)
The forecast
Using the periodicty of 25.083 years in the data, it is now possible to make a forecast.
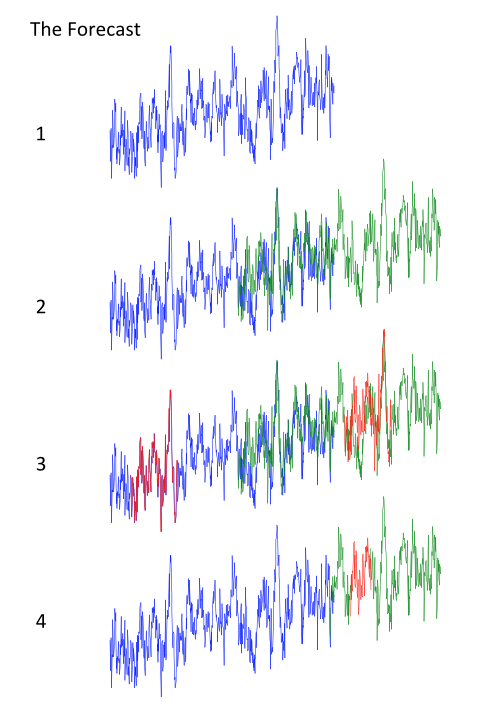
1. Blue: Observation 2. Green: Observations shifted 25 years and 0.65 degrees up 3. Red: fragment without Pinatubo cooling is copied 4 Cleanup.
(Click in the image for fullscale pdf download)
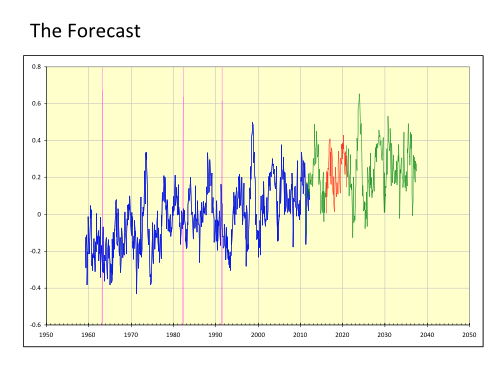
Using the historic CO2 data I can now forecast two temperature events in the coming years:
(Click in the image for fullscale pdf download)
-
+ For 2013, I forecast a strong El Nino, but not as strong as the 1998 event;
+ For 2023, I forecast a new super El Nino, in amplitude comparable with the 1998 and 1973 events and with a maximum value of 0.66 degrees. After 2023 the temperature will remain on a new plateau for another 25 years, which will be 0.163 degrees higher than the current plateau.
Acknowledgements
Thanks to Jarl Ahlbeck who came up with the idea of the Carbon Dioxide Thermometer
Thanks to UAH and NOAA for putting the Mauna Loa and the AMSU data online.
This research was not funded.
Links
CO2 data:
ftp://ftp.cmdl.noaa.gov/ccg/co2/trends/co2_mm_mlo.txt
MSU data:
http://vortex.nsstc.uah.edu/data/msu/t2lt/tltglhmam_5.4
Carbon Dioxide Thermometer links:
http://www.john-daly.com/co2-conc/co2therm.htm
http://www.john-daly.com/co2-conc/updated.htm



Hans je schrijft:
After 2023 the temperature will remain on a new plateau for another 25 years, which will be 0.65 degrees higher than the current plateau.
Ben je er zeker van dat dit 0.65 is (lijkt me een beetje veel) of is het 0.065?
@Hans: interessante materie. Ik kom morgen met een artikel over een nieuwe theorie dat SO2 wel eens de hele arctic warming zou kunnen verklaren. Wat ik mis in je weergave is enig commentaar. Wat is jouw visie hierop? Mij lijkt het zeer onwaarschijnlijk dat er een dergelijke causaliteit zou zijn tussen CO2 en temperatuur. Omgekeerd eventueel wel. Wat zegt Ahlbeck daarover? En hoe denkt hij te kunnen voorspellen zonder andere invloeden in zijn voorspelling te betrekken? Hoe kan hij de zon negeren?
Graag jouw toelichting hierop…
Wat me opvalt is dat de voorspellingen een duidelijke stijging laten zien van de temperatuur. Misschien is er toch een verband tussen co2 stijging en temperatuurstijging en zorgen zaken als een el-nino alleen maar voor wat ruis op de stijgende trend.
Of een verband tussen temperatuurstijging en Co2 stijging.
Knap gevonden!
Maar in mijn ogen niet bruikbaar voor voorspellingen. Alles hangt namelijk af vanwaar je het nieuwe stuk grafiek aan de oude vastplakt. Daar zegt de correlatie namelijk niets over.
Het lijkt eerder een zich herhalend patroon van stijgingen en dalingen. Daarvoor zouden drie verklaringen zijn:
1. Dit is een patroon dat gewoon deel uitmaakt van een cyclus, en geeft geen informatie over de gemiddelde waardes in de toekomst
2. Het is een cyclisch verschijnsel waarvan de invloed op het ene symptoom 13 jaar later zichtbaar wordt dan die op de andere.
3. CO2 beïnvloedt de temperatuur met een vertraging van exact 13 jaar, zonder afvlakking of middeling.
In de eerste twee gevallen is CO2 niets anders dan een symptoom.
Geval drie is vooralsnog onverklaarbaar en bijzonder onwaarschijnlijk.
@Amadeus: Correct, 0.65 is de dCO2 stap, de temperatuurstap is 0,163 graden, dat betekent dus een lukewarme opwarming van 0.65 graden per eeuw! Ik heb de tekst aangepast.
@Hajo: De verklaring voor de CO2 thermometer is simpel: een koude oceaan neemt sneller co2 op dan een warme, het is het colakook effekt. Ik zal later nog een Discussion paragraaf toevoegen over de implicatie voor climate sensitivy.
@baksteen: nee
@Theo: We zullen zien, in ieder geval hebben we nu een voorspelde waarde waar je me volgend jaar al (!) over kunt afrekenen. Over 11 jaar weten we het helemaal zeker. Dit is mijn "lukewarme" verwachting. Goed nieuws dus!