
Cartoon: Josh.
Eerder schreef Hugo Matthijssen op Climategate.nl dat we het met zonne– en windenergie niet gaan redden.
Wind en zon leveren niet voldoende energie en kosten een vermogen.
Maar ze dragen in ieder geval bij tot een substantiële reductie van de CO2–uitstoot, toch? Oeps! Dat blijkt niet uit de cijfers!
Onder de titel, ‘Renewables and climate policy are on a collision course’, analyseerde John Constable voor de ‘Global Warming Policy Foundation’ (GWPF) de laatste mondiale ontwikkelingen van het energieverbruik en de CO2–uitstoot. Ik pik een aantal elementen uit zijn betoog.
Those advocating climate change mitigation policy have hitherto wagered everything on the success of renewable energy technologies. The steadily accumulating data on energy and emissions over the period of intense policy commitment suggests that this gamble has not been successful. Pragmatic environmentalists will be asking whether sentimental attachment to wind and solar is standing in the way of an effective emissions reduction trajectory.
For almost as long as there has been a climate policy, emissions reduction has been seen as dependent on the replacement of fossil fuels with renewable energy sources. Policies supporting this outcome are ubiquitous in the developed and developing world; markets have been coerced globally, with varying degrees of severity it is true, but with extraordinary force in the OECD states, and particularly in the European Union. The net result of several decades of such measures has been negligible. Consider, for example the global total primary energy mix since 1971, as recorded in the International Energy Agency datasets, the most recent discussion of which has just been published in the World Energy Outlook (2018):
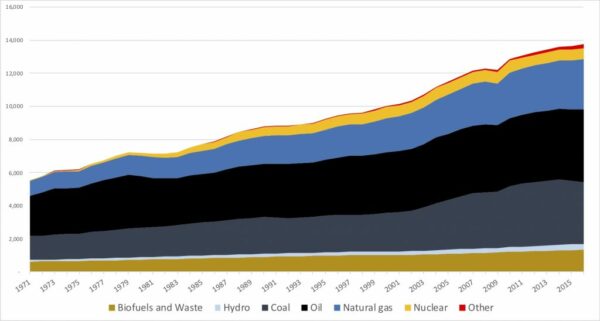
Figure 1: Global Total Primary Energy Supply: 1971–2015. Source: Redrawn by the author from International Energy Agency, Key World Energy Statistics 2017 and 2018. IEA Notes: 1. World includes international aviation and international marine bunkers. 2. Peat and oil shale are aggregated with coal. 3. “Other” Includes geothermal, solar, wind, tide/wave/ocean, heat and other.
It is perfectly true that the proportional increase in modern renewables, the “Other” category represented by the thin red line at the top of the chart is a significant multiple of the starting base, but even this increase is disappointing given the subsidies involved, and in any case it is almost completely swamped by the increase in overall energy consumption, and that of fossil fuels in particular. Renewables in total, modern renewables plus biofuels and waste and hydro, amounted to about 13% of Total Primary Energy in 1971, and in 2016 are almost unchanged at somewhat under 14%. Thirty years of deployment, almost half of that time under increasingly strong post-Kyoto policies, has seen the proportion of renewable energy in the world’s primary energy input creep up by about one percentage point. …
It should therefore come as no surprise to anybody that emissions not only continue to rise, but have recently started to increase at the highest rate for several years, a point that is revealed in the latest release of the Global Carbon Budget, 2018, and can be conveniently illustrated in the chart derived from this paper’s data and published in the coverage of the Financial Times:

Figure 2: Global Emissions 1960 to 2018. Source: Financial Times, 6 December 2018, drawn from Global Carbon Budget Report 2018.
Lees verder hier.
Grappig is dat de verhoogde CO2–uitstoot niet gepaard is gegaan met een stijging van de temperatuur. Die is de laatste twee jaar fors gedaald. Men moet er dan ook voor hebben doorgeleerd om uit deze metingen te concluderen dat CO2, en in het bijzonder door de mens uitgestoten CO2, een dominante invloed uitoefent op de gemiddelde wereldtemperatuur.


Dat molens en zonnepanelen geen brandstof sparen wisten we al lang, Dat is netjes uitgezocht en voor iedereen toegankelijk gepubliceerd. Niet alleen de Nederlandse groep “Udo” maar ook tal van buitenlandse groepen hebben dat onderzocht en kwamen tot de zelfde uitkomst. Het staat netjes op de webstek van Fred (https://fredudo.home.xs4all.nl/Zwaaipalen/Titelpagina.html) en op die van mij (http://www.clepair.net/#Wind). Climategate heeft er meermalen de aandacht op gevestigd. Het is alleen luid overschreeuwd door molenaars, zonaanbidders en hun gelovige volgers.Beide systemen produceren best elektrische energie. Niemand die dat bestrijdt. Alleen de bijbehorende besparing van fossiele brandstof en CO2 ontbreekt. Het gevolg is dat je geen vermindering merkt in het verbruik van fossiel. Dus figuur 1 is niet verbazingwekkend. Bij een groeiend energieverbruik stijgt het fossiele deel deel tenminste net zo hard als het alternatieve. De grondstof gaat naar het staal en plastic van de molens, de generatoren, het materiaaltransport, de afgenomen efficiëntie van de achtervang – je wilt stroom als het nodig is, niet alleen als het waait – en conversie, bekabeling werk op zee enz. Alles wat tot 2018 aan zonnehulp op onze daken verscheen zal gedurende zijn hele leven niet meer energie leveren dan er eerst door Chinese kolenboeren en oliesjeiks is ingestopt. Bij de nieuwere gaat het beter en in de pijplijn zijn nog mooiere, maar om onze welvaart te behouden moeten die dingen tenminste zeven keer zoveel energie leveren, als er eerst is ingestopt, Dat halen zelfs de theoretisch beste in de verre toekomst niet. Dus we worden armer. Straatarm zelfs, als we op die techniek blijven inzetten. Het heeft ook helemaal geen zin te praten over wie het betaalt. Het is een economische afvoergoot. Ook bij volledige werkgelegenheid doordat iedereen molens bouwt en zonnepanelen monteert. Dan zorgt niemand meer voor ons eten, onze wegen, ons onderwijs en onze gezondheid. “Geld weggooien” lijkt een goede beschrijving maar dat is het niet. Wanneer ‘de industrie betaalt’, moeten wij die industrie betalen, anders verdwijnt ze. We moeten stoppen met dingen doen die geen nut hebben, anders is de inspanning zo goed als niet gedaan. Dan wacht ons kou en honger.
“Straatarm” ….. “kou en honger” Het is toch wat. In het eigen manifest op de lepair site staat het volgende:
” In werkelijkheid kunnen ze (de windmolens) niet meer dan een derde besparen van de fossiele brandstof die wij nu voor die elektriciteit gebruiken”
Goh, denk ik dan, dat is dan in het meest pessimistische uitgangspunt nog altijd een derde. Dat valt nog wel mee. Nu is ook die 33% opeens als sneeuw voor de zon verdwenen. Wat moeten mensen daar wel niet van denken?
Hermie
Begrijp nou toch dat die derde verloren gaat door alle rimram erom heen.
@Peter, Het staat toch keihard zwart op wit. Windmolens besparen een derde aan fossiele brandstoffen. Maar een paar dagen later roept dezelfde Le Pair gerust dat windmolens geen fossiele brandstoffen besparen. Hoe betrouwbaar ben je dan?
@ C.le Pair.
Op de site van de groene rekenkamer is nu te zien dat er in Denemarken,
A. 6300 megawatt aan elektriciteit opgewekt wordt.
B. waarvan 2000 megawatt door fossiele centrales.
C. en 4300 megawatt door windmolens.
D. het verbruik van het Deense net = 5000 megawatt.
E. de export is 1300 megawatt.
F. de co2 uitstoot per kilowatt opgewekte energie = 107 gram per KWH .
Hoezo dat windmolens geen brandstof uitsparen!!!
Ik vind de site van de groene rekenkamer geloofwaardig.
Denemarken, met de duurste electricteit ter wereld, blijft alleen overeind door hydro backup uit Noorwegen dacht ik.
@ j.e.reinders
“Ik vind de site van de groene rekenkamer geloofwaardig.”
Nu dat is mooi want daar schrijven dezelfde auteurs over dezelfde onderwerpen als op deze site.
Ja en die cijfertjes en het begrijpen vereist wat meer inzicht in deze materie.
@Reinders Vandaag waait het een beetje, zogezegd. Ik zou u aanbevelen eens een jaar lang elke dag dat onderdeel op de site te raadplegen. Dan krijgt u het beeld waar C. Lepair het over heeft.
@ j.e.reinders
Die mix klopt zo ie zo niet want in Denemarken wordt een groot deel van de elektriciteit opgewekt door biomassa.
Hier de Denemarkse cijfers per uur, dag, maand, etc. Let op de grote verschillen tussen tijdsintervallen, dat zorgt voor grote rendementsdaling (meer fossiel verbruik voor dezelfde hoeveelheid elektriciteit) bij de conventionele centrales.
https://twitter.com/ReliableAB
Reinders,
Van het totale energie verbruik in Denemarken is 19% afkomstig van wind en 47% van olie.
Kees Lepair
Bedankt voor je duidelijke uiteenzetting op dit punt. Helemaal mee eens. Er is geen woord Spaans bij.
Zoekplaatje: wie het eerst het verband tussen CO2-toename en temperatuurtoename kan aantonen wint een dagje uit met Rutte:
https://wattsupwiththat.files.wordpress.com/2013/06/co2_temperature_historical.png
En wie als eerste de wetenschappelijke publicatie waar deze figuur uit komt kan aangeven krijgt van mij een flesje wijn!
En als het niet uit een wetenschappelijke publicatie komt waarom zijn er dan mensen die het beter denken te weten dan de wetenschappers zelf ?
@J van der Heijden Kom maar op met die fles wijn. De bronvermelding staat onder de figuur. Ja, dat is een wetenschappelijke publicatie.
Proost :-D
Nee de figuur komt niet uit een wetenschappelijke publicatie, maar is een samentrekking uit 2 publicaties en is samen gevoegd door een “scepticus” zonder dat hij echt heeft opgelet wat er in de publicaties staat.
Jammer Hermie, beetje opletten!
De temperatuur is schematisch en dus geen goede reconstructie
realclimate.org/index.php/archives/2014/03/can-we-make-better-graphs-of-global-temperature-history/
Verder wordt er natuurlijk ook geen rekening gehouden met de invloed van de zon in het hele verhaal.
pdfs.semanticscholar.org/cab1/810561360762463dddc8e9615dc70b67f05d.pdf
searchanddiscovery.com/documents/2009/110115royer/ndx_royer.pdf
geosociety.org/gsatoday/archive/14/3/pdf/i1052-5173-14-3-4.pdf
Jan wil geen fles wijn betalen, is te zuinig.
Erik,
ik wil wel een fles wijn betalen maar de figuur komt niet uit een wetenschappelijke publicatie.
Dit is gewoon totale onzin gepubliceerd op een blog en wijd verspreid door wat goedgelovigen zonder verstand van zaken
Ik accepteer de onderbouwing. http://www.realclimate.org/index.php/archives/2014/03/can-we-make-better-graphs-of-global-temperature-history/
Wat is er eigenlijk van die “lord” Moncton geworden? Horen we daar nog wel eens wat van?
Gerard,
HIer is nog een studie die niet alleen een verband, maar zelfs een OORZAKELIJK verband tussen CO2 en de recente opwarming aantoont,. Ik heb die hier al meerdere keren geciteerd, maar die wordt hier steeds weer genegeerd , of met drogredeneringen afgeserveerd.
https://www.nature.com/articles/srep21691
En laat ik het nu eens volledig eens zijn met de slotzin van Hans Labohm:
“Men moet er dan ook voor hebben doorgeleerd om uit deze metingen te concluderen dat CO2, en in het bijzonder door de mens uitgestoten CO2, een dominante invloed uitoefent op de gemiddelde wereldtemperatuur”
Ronald
Jij hebt er kennelijk niet voor doorgeleerd, anders had je het antwoord wel gegeven neem ik aan?
.dubbele scherts peter!..mvg…bart f..
Peter,
Als je er wel voor had doorgeleerd en een klein beetje had opgelet in de laatste discussie dan had je ergens in de 1e reactie kunnen lezen dat het afkoelen van de laatste 2 jaren het gevolg is van ENSO en gewoon gebeurt in lijn met de verwachtingen. Dit heeft dus helemaal niets te betekenen en je kunt er geen conclusies uit trekken of het nu opwarmt of afkoelt.
Iedereen die je wat anders probeert te vertellen is een charlatan en zal je niet serieus moeten nemen
“5/ Het is gewoonweg ruis: er zijn altijd jaren die stijgen en die dalen. Je kan daaruit geen conclusies trekken!
6/ Er is geen enkel argument om te veronderstellen dat er een lange-termijn dalende trend is ingezet. het is gewoon wensdenken van Labohm en de AGW-negationisten.”
Kun je even aangeven wat je hier niet van begrijpt?
Dus als de temperatuur daalt heeft het niets te betekenen en als deze stijgt is het opwarming van de aarde door toedoen van de mens. Redeneren naar een gewenst resultaat. Is dat wetenschap?
Jan,
Wat verwacht je na de huidige La Niña? Gaat de temperatuur verder naar beneden, of weer omhoog. In het laatste geval ben ik erg nieuwsgierig of er weer sprake zal zijn van een sprong omhoog naar het volgende plateau.
Erik,
Er is geen enkele goede reden om aan te nemen dat de opwarming gestopt is, we gaan dus gewoon verder omhoog.
En nee voor jouw temperatuur sprongen heb je geen enkele wetenschappelijke onderbouwing en ook na een keer of 100 vragen kan je nog steeds geen verklaring geven hoe een El Nino de temperatuur van de atmosfeer duurzaam kan verhogen.
Je verklaard dus niets en het is dus geen wetenschap
Ivo,
er is een simpele manier om te kijken of de temperatuur daalt of stijgt en dat is kijken of de trend statistisch synificant is.
En of de trend afwijkt van de voorgaande trend.
UAH v6.0
1985-2015 0.116 ±0.090 °C/decade (2σ)
1988-nu 0.127 ±0.086 °C/decade (2σ)
Er is dus sprake van versnelling van de opwarming !
2016-nu -1.378 ±1.957 °C/decade (2σ)
gebaseerd op de berekende waarde zou je vanaf 2016 kunnen zeggen dat het 0,6C per 10 jaar opwarmd of 3.3C per 10 jaar afkoelt.
Uiteindelijk kijk je dus naar ruis en niet naar signaal.
Andere oplossing is om bijvoorbeeld alleen de trend door El Nino, La Nina of neutrale jaren te maken
zoals bijvoorbeeld hier gedaan is
theguardian.com/environment/climate-consensus-97-per-cent/2018/jan/02/2017-was-the-hottest-year-on-record-without-an-el-nino-thanks-to-global-warming
of corrigeren voor de verschillende reeds bekende factoren
tamino.wordpress.com/2019/01/04/global-temperature-adjusting-data-cowtan-way/
ErikN,
Op dit moment staat de ENSO meter op 0.5 (temperatuuranomalie van een standaard gebied rond de evenaar in de Stille Oceaan). Dit is iets boven neutraal. Bij een waarde boven 1.5 spreekt men van een El Niño, onder -1.5 van een La Niña.
De El Niño van 2016 was na een jaar uitgewerkt.
Als het afkoelt bij een licht positieve ENSO meterstand, dan wijst op invloed van andere mechanismen.
Ronald
Laat ik nou gedacht hebben dat in de constatering van Hans Labohm een verzoek om nadere uitleg besloten lag. Enkelen hadden het kennelijk zo begrepen en zijn er dus wél ingevlogen. Maar dat heb jij niet zo begrepen dus.
Je laat je niet zomaar uit de tent lokken. Of is het bescheidenheid?
Antwoord, Peter? Op welke vraag? Ik zie geen vraag. Je ziet dingen die er niet zijn. Daar hebben complotters wel vaker last van.
Alles draait de laatste tijd om co2 de een zegt dit de ander dat, de een wil je brainstormen met alle geweld dat co2 de boosdoener is,en noem maar op.
Maar anno 2019 spoelen we wel onze wc nog steeds door met schoon drinkwater, terwijl er landen zijn die schreeuwen om zuiver H20.
Maar ja daar hoor je niemand over we hebben immers genoeg!
@Theo, We hebben inderdaad meer dan genoeg en in andere landen schreeuwen ze om zoet en schoon H2O (liever niet zuiver, dat is niet zo goed voor je) Als we nu eens die 1.000 miljard inzetten voor schoon drinkwater in de wereld dan denk ik dat we een heel eind komen. Hebben we een deal?
..welke 1000 miljard hermie?….in of exclusief t energieverbruik?….in t eerste geval blijft er fiks minder vrij te besteden over..mvg…bart f
@bart Nog even geduld @bart, het schijnt te maken te hebben met 3% BBP en het vermenigvuldigen over 40 jaar. Een soort climategate.nl formule. Ik wacht nog op bevestiging van Scheffer. Als ik niets meer van hem hoor dan ga ik uit van “wie zwijgt stemt toe” Ik zal je vandaag uitleggen hoe het zit.
@bart, Laten we er maar aan beginnen. Scheffer is afgehaakt. Zullen we het over 30 jaar bekijken zoals jij voorstelde?
De kosten voor onze huidige energie voorziening zijn nu 30 miljard per jaar. dat is inclusief alles.
Doen we verder niets en blijven de prijzen gelijk dan zijn de kosten in 30 jaar dus 900 miljard.
Door een schatting van prijsstijging fossiel komen de kosten in 2050 op:
minimaal: 40 miljard per jaar
maximaal: 80 miljard per jaar
Nu kunnen we het beste een gemiddelde nemen in die 30 jaar ( 30+40)/2 en (30+80)/2 en dat maal 30
dat wordt dan:
minimaal 1050 miljard in 30 jaar
maximaal 1650 miljard in 30 jaar.
We hebben dan nog niets gedaan met de transitie.
wat nu als we de energietransitie aangaan?
dan wordt het :
minimaal 45 miljard per jaar in 2050
maximaal 75 miljard per jaar in 2050
We nemen weer het gemiddelde: (30+45)/2 en (30+75)/2
Dat wordt dan:
minimaal 1125 miljard in 30 jaar
maximaal 1575 miljard in 30 jaar
De energie transitie kost ons dan bij minimale stijging van fossiele prijzen:
1125 – 1050 = minimaal 75 miljard in 30 jaar
1575 – 1050 = maximaal 525 miljard in 30 jaar
Of bij maximale stijging van fossiele prijzen levert het geld op:
1650 – 1125 = maximale winst in 30 jaar: 525 miljard
1650 – 1575 = minimale winst in 30 jaar: 75 miljard
De schatting van de energietransitie (kosten dan wel opbrengst) ligt tussen 525 miljard negatief en 525 miljard positief. De gemiddelde schatting aan kosten voor de transitie is dus NUL Euro. bron CE Delft. Mee eens? Hoe ik nu naar 1.000 miljard moet weet ik even niet. Heb jij een voorstel?
.beste hermie…ik zit nu in mn kroegje…geef je me even belet om nuchter te reageren?…bvb dank..mvg…bart f..
Hermie.
Is dit de methode reken je rijk? Gaf ik daar gisteren of was het eergisteren niet een voorproefje van? Stuur je berekening van je naar de Tweede kamer met een kopietje aan Delft. Kunnen ze tossen wat het wordt.
@Peter, Die berekening hebben ze al. Baudet vroeg er naar maar hij heeft het antwoord niet begrepen. https://www.ce.nl/assets/upload/file/Presentaties/2018/CE%20Delft%20Kosten%20van%20klimaatbeleid.pdf
beste hermie @ 8 jan 17.29… bedankt voor je uitvoerige beantwoording, maar……wat mij nog steeds niet duidelijk is….helaas ondanks jouw uitvoerige antwoord ook nog niet …..of je het jaarlijkse energieverbruik….volgens jou nu 30 miljard per jaar….moet optellen bij de gasombouw-, subsidie- en overige kosten die door baudet c.s. op grofweg 1000 miljard geschat worden….?…..mvg…bart
@bart, Nee, dat is inclusief. Baudet had het niet goed begrepen. Je ziet in het document dat de kosten voor woningverwarming ook als hoog worden ingeschat. ” De grootste kostenstijging zit bij de verwarming van gebouwen “
@Hermie,
Waarom moet jij toch altijd zo overdrijven?
En op ieder die het niet eens is met je,lig je gelijk op in te hakken of alles klopt wat jij zegt.
Doe eens mee aan het tv programma de slimste mens!
Trouwens ik neem aan dat jij al helemaal los bent van het gas, zonnepanelen, zonneboiler, een electrische vervuilende accu bak rijd, en natuurlijk ook je eigen opgewekte stroom opslaat in je huis zodat je hem als het donker is weer gebruikt.
Met andere woorden je bent helemaal zelfvoorzienend, behalve soms met eten waar ze bij de bereiding in de fabriek gas hebben gebruikt al dan niet direct of via centrales.
Amen.
@Theo, Ik overdrijven? Toe nou zeg. Ik ga gewoon mee in de algehele gekte hier. 1.000 miljard….. proest.
Nee Theo, ik ben niet los van het gas, en van mij hoeft ook helemaal niemand los van het gas. Misschien moet je nog maar eens doorlezen wat ik schrijf.
Moet ik nu opmaken uit je reactie dat je geen geld over hebt voor de watervoorziening in anderen landen?
Hermie
Ik probeer op basis van de aannames van Urgenda hier vast een sommetje te maken. 50% van de bestaande woningvoorraad moet nog geïsoleerd worden.
Kosten per woning gemiddeld 35.000 euro voor een aanpassing om geschikt te zijn voor een warmtepomp. Dat x 3,8 miljoen woningen maakt dus 133 miljard. De aanpassing van de overblijvende beter geïsoleerde woningen = 42% van tussen 1985 en 2005 is dan nog niet meegerekend. De 8% van na 2005 is voldoende geïsoleerd maar ook vaak nog aan het gas aangesloten. En dat voor voor 20 % van het totale energie gebruik.
Reken even verder zelf uit wat de rest gaat kosten, windmolens, zonnepanelen, netverzwaring, infrastructuur laadpalen en brandstofpompen, vervanging wagenpark etc. of neem de moeite het gasdebat nog eens te bekijken.
https://www.elsevierweekblad.nl/nederland/achtergrond/2018/06/live-gasdebat-626794/
@Hermie
O, jawel, ik heb die 1000 miljard vaak los in mijn broekzak hangen, dan denk ik wat moet ik er mee!
En dat water verspilling noem ik als voorbeeld, er zijn nog genoeg plaatsen in Europa waar je beter een flesje bronwater kunt kopen dan water uit de kraan drinken.
Maar waarom noem je dan dat voorbeeld @Theo? Dat schept toch verwachtingen?
Hermie
Misschien kan dit je voor je vervolgberekeningen behoeden. Waar doen we het voor als het niets bijdraagt. Er zijn inderdaad zinniger zaken om het geld aan uit te geven. Zelfs als het géén 1000 miljard is.
https://www.eike-klima-energie.eu/2019/01/08/windturbinen-sind-weder-sauber-noch-gruen-und-sie-erzeugen-null-globale-energie/
@Peter, Met die 50% moet je daarom ook helemaal geen haast maken. De eerste 50% heeft blijkbaar ook 133 miljard gekost. Geheel geruisloos en vrijwillig. Wie stond te brullen en te schreeuwen? laat dat isoleren dan ook in de toekomst vrijwillig gebeuren. Of blijf met dat deel lekker op gas draaien.
De huishoudens gebruiken 22% van de totale energie. Neem even aan dat ongeveer 18% daarvan voor gas is. Daarvan de helft is 9%. Indien je door transitie ongeveer 50% bespaart ( vergeet de gascentrales niet) bespaar je dus slechts 5%
Wat de rest gaat kosten? Hangt van 1.000 aannames af. Zinloos om dat uit te rekenen. Wat wel zin heeft om te bespreken is wat we per jaar over hebben voor de energietransitie. Jij hebt daar NUL Euro voor over, ik een paar miljard en een alarmist heel erg veel.
Tja, Waar doen we het voor Peter. Aan welke zinnige zaken wil jij meer geld besteden?
Gemiddelde onderhoudskosten woning: 3600 euro per jaar volgens vereniging eigen huis. Met 7 miljoen woningen zouden we tot 2050 756 miljard aan woningonderhoud uitgeven. Laat nou een gedeelte van dat onderhoud overlap hebben met maatregelen om woningen beter te isoleren. Ik heb nooit iemand horen klagen over die 756 miljard.
In mijn geval, afgelopen 15 jaar ca. 40k uitgegeven aan verbouwingen voor een jaren 30 woning en tegenwoordig bijna energieneutraal. Enige nuance, ik heb alles zelf gedaan dus geen looncomponent in de 40k.
Lezen Hermie
Waar haal je het vandaan dat die eerste 133 miljard gekost heeft? Die eerste 50% is dus niet geïsoleerd, de 2e 42% is te weinig geïsoleerd voor warmtepompen en moet nageïsoleerd worden. Als dat al kan. Als de spouw al gevuld is kan dat dus niet of alleen aan de buitenkant.
Een groot deel van die eerste 50% betreft huurwoningen die zeker geen 3600 euro onderhoud hebben gekregen. Laten de huurders zich daar maar eens over uitspreken. Daarom krijgen de woningbouwcorporaties zeker 1 miljard?
De kosten van de vereniging eigen huis zou ik wel eens gespecificeerd willen zien. Daarbij zijn de te maken kosten van een geheel andere aard. Wanneer ik naar mijn woning kijk zou ik niet weten waaraan ik dat uit zou moeten hebben gegeven. Als je om de 10 jaar een nieuwe badkamer, een nieuwe keuken en nieuw parket wilt en er ook nog om de twee jaar een schilder aan wilt zetten klopt het helemaal. De kosten waarover het hier gaat zijn totaal andere kosten die nauwelijks overlap hebben met de kosten die ook een huurder maakt. Een vergelijking met zelf doen zonder specificatie zegt dus helemaal niets. Alleen dat je misschien handig bent.
Hermie
Tja, waar doen we het voor? Dat vroeg ik me nu ook af. Water naar de zee dragen helpt niet. Zoutwater naar het land nog minder, Leg jij maar uit waar we het voor doen. Om de zeespiegel minder te laten stijgen? Dat helpt in beide gevallen niet. En als dat, wat ik heel aannemelijk vind en in het artikel goed en duidelijk geschetst en op de site van het IEA grafisch duidelijk is weergegeven, niet helpt, moet je dat geld, of het nu 100, 500 of 1000 miljard is, niet uitgeven.
Besteedt het liever aan onafhankelijk onderzoek en scholing en aan aantoonbare bedreigingen. Aan dijkverzwaring/verhoging, waterberging, een betere infrastructuur, een betere ouderenzorg, aan betere huisvesting. Maar altijd op basis van een duidelijke kosten baten analyse. En daar horen volledigheidshalve ook niet materiële zaken bij.
Hermie
Ik weet niet hoe je aan die 18% voor gas komt. Mijn energierekening bestond vorig jaar voor één vierde deel uit elektriciteit en voor 3/4 deel uit gas. Maar wil ik daar iets tegen doen moet ik 35.000 lenen om beter te isoleren. Dat laat ik dan graag aan een ander over. Scheelt een heleboel gedoe en een boel rommel. Daarbij lijkt het me volledig aan mij om daarin beslissingen te nemen zonder dat de overheid gaat pressen en dringen. Hoe gemakkelijk denk je anders dat je de hele burgerij meekrijgt.
Daarom, ik roep het al heel lang, kalmpjes aan. Begin bij de nieuwbouw, vervolgens of parallel daaraan, afhankelijk van de bouwcapaciteit de woningen onder beheer van de woningbouwcorporaties energie- en kostenneutrale woningverbetering. En dat moet kunnen, ervan uitgaande dat de transitie een feest wordt. Voor de huurder dan, omdat de huren dan niet méér mogen stijgen dan de inflatie. Lijkt me alleszins redelijk.
@Peter, Die 18% is even een schatting uit de losse pols. Maar die klopt toch vrij aardig als ik naar jouw energierekening kijk? 18/22 = 80% Zullen we er 17% van maken? 17/22= 77%.
Ja, die beslissingen moet ook alleen bij jou liggen. En ja, Precies, we hoeven geen haast te zetten bij bestaande bouw van huiseigenaren die niet geïsoleerd is. Vergeet overigens niet dat het de bedoeling is dat op veel plaatsten warmtenetten (Wnet) worden aangeboden.
1. Nieuwbouw
2. Bestaande bouw woningbouwverenigingen Wpomp/Wnet
3. Bestaande bouw geïsoleerd – Wpomp/Wnet
4. Bestaande bouw niet geïsoleerd – Wnet/gas
5. Bestaande bouw niet geïsoleerd – Vrijwillige isolatie/Wpomp
6. Ben ik nog een categorie vergeten?
Volgens mij zijn we het toch grotendeels eens?
Hermie
Ah, nou snap ik je 18%, ik kwam wat lager uit. Dat kwam oor de genereuze teruggave van de overheid op de elektriciteitsrekening.
Maar te vroeg gejuicht, je hebt er nog een post bij gevonden, de fameuze warmtenetten. Zeg maar de collectieve buurtwarmtepomp.
Daar moet nog van worden uitgerekend wat dat gaat kosten. Mooie techniek, kost geen fossiele brandstof als je de elektriciteit anders opwekt.
Maar volgens mij ging het over de kosten/batencomponent enerzijds en de veronderstelde bedreiging anderzijds. Leuk lijstje overigens.
Zouden de kosten van al dat moois nu een lágere of een hógere energierekening opleveren? De belasting die nu op energie geheven wordt krijgt namelijk straks een andere naam. Betalen moet je toch. Je moet dus uitgaan van de basisprijs energie/gas/elektriciteit. Voorlopig wordt de rekening hoger en van het feestje voor de portemonnee heb ik nog niets gemerkt.
@Peter, Zodra je energie bespaart levert je dat uiteindelijk geld op. Waarom denk je dat mensen bijvoorbeeld 133 miljard geheel vrijwillig hebben uitgegeven aan isolatie de afgelopen jaren? Een feestje voor de portemonnee: Heb je al zonnepanelen?
Tja, dat door de wc spoelen van drinkwater staat mij ook wel eens tegen maar we hebben als delta van Europa nu eenmaal gigantisch veel schoon en zoet water ter beschikking. Het hoeft nauwelijks behandeld te worden, daarom is het ook zo goedkoop. Pas heb ik nog een sommetje gemaakt met de waterrekening er naast. Voor €170 heb je 60m3 water, mijn jaarverbruik. Daar ga je geen hydrofoor met bijbehorend leidingwerk voor aanschaffen, hoewel ik een regenput met 1,5m3 om de deur heb zitten.
@Gert, daar heb je wel gelijk in, maar je vergeet een ding, het gaat van jou uit weer naar de waterzuiveringsinstallatie, waar het dan van bij ons dorp genomen weer de maas in gaat. Daar betaal je natuurlijk ook weer voor. Dan word de prijs van het water wel in een keer weer duurder. Wij hebben hier bijna 20 jaar een hydrofoorpomp in gebruik gehad. Deze pomp stond mooi koel in de kelder en het werkte perfect.
Trouwens hier in ons plattelands dorp hebben meerdere mensen dit zo in gebruik. Vandaar dat ik ook op dat idee kwam. Maar toen de kinderen uit huis waren heb ik ze alleen nog maar voor de tuin, auto en dat soort dingen.
Net als alle voorgaande hypes waait die van CO2 weer over, hopelijk een beetje snel.
Benieuwd wat er dan weer bedacht wordt.
.op de waddenzee nu zeker..de boot van vlieland kon met moeite aanlevge in harlingen…mvg..bart f..
..ik bibber er nog van….aanleggen..dus
Kritisch kijken naar het rendement van verschillende energiebronnen is natuurlijk prima.
Maar onzin verkopen over de temperatuurtrend dat schiet niet op. Hoezo afkoeling in de laatste paar jaar? Het heeft helemaal geen zin om op een termijn van 2 jaar te kijken.
http://www.logboekweer.nl/Actueel/UAH_Trend2018.PNG
Waarbij opgemerkt dat UAH na de aanpassingen een paar jaar terug de meest gematigde temperatuurreeks is. Metingen aan de grond, en andere satellietreeksen laten een nog sterkere stijging zien.
Daar zitten we in 40 jaar ongeveer op 0,4 stijging, precies het tempo dat al eeuwen aan de gang is. Nu is het plotseling een komende ramp geworden. Eigenlijk bestaat er maar één soort ramp op de wereld: uitbuiting van mensen op ongekend grote schaal. Eet smakelijk.
Baart Vreeken
Ooit zal die temperatuur weer naar beneden gaan. Weet jij wanneer? of hang je de theorie van Schellnhuber aan die meent dat dat nog wel eens 100.000 jaar kan duren. En normaal interglaciaal duurt kennelijk 10.000 jaar. Een ijstijd 100.000 jaar. Hoe lang is de laatste ijstijd geleden? Of denk je dar die ijstijden spontaan ophouden? Ik ben benieuwd of jij me kan zeggen waar we ergens zitten op de flank van de stijgende temperatuur van het huidige interglaciaal.
Sorry, Bart dus
Er is natuurlijk geen reden om aan te nemen dat de ijstijden spontaan ophouden. Waarom zou dat zo zijn? Maar h is niet bekend hoe het verhoogde broeikaseffect hierop inwerkt. En ook Salomon Kroonenberg verwacht de volgende ijstijd pas over 10000 jaar.
https://www.nemokennislink.nl/publicaties/na-de-broeikas-komt-de-ijstijd/
Bart Vreeken
Gelukkig dat het nog even relatief warm blijft. Maar toch wel vreemd zo’n lang interglaciaal. Daar kun je dus de klok ook al niet op gelijk zetten.
Moet ik nu zuinig met m’n water doen, omdat er ergens in de Sahara dorst wordt geleden? Moet ik me daar echt schuldig over voelen? En als ik m’n plee doorspoel met regenwater, heeft die verdorstende Afrikaan het dan een stuk beter? Kom op zeg.
Windmolens bouwen in Engeland is zinloos, want het waait niet hard genoeg. Volgens de CEO van de grootste wind energie bedrijf in Groot Brittannië. Het bedrijf bouwt nog wel wat windparken, maar enkel in Schotland en Wales.
https://twitter.com/ClimateRealists/status/1081962762262204417
@MP, daarom moet je windmolenparken ook op zee bouwen….
@ Hermie
Waarom is in Nederland dan die bizarre hoeveelheid op land in de planning?
En het is maar de vraag of de Noordzee genoeg wind heeft om het echt zinvol te laten zijn. Atlantische winden zijn natuurlijk veel sterker en meer frequent.
@MP, Ik heb het niet voor het zeggen, maar ik zou stoppen met wind op land. De kosten voor wind op zee zijn nu zodanig dat er op dit moment geen prijsverschil meer is. Atlantische winden op hogere breedte zijn vast veel sterker maar waterdiepte en afstand tot land is een belangrijke factor. Op de Noordzee kan het best goed waaien hoor. Zie live Gemini: http://livemegawatt.com/gemini/
Hermie
Dan worden de totale kosten, plaatsen netwerk, onderhoud, wel hoger en wat zou dat dan betekenen voor de rendementen? Kosten-baten. Zeker als je veronderstelde bedreigingen er niet mee worden opgelost.
@Peter, De totale kosten kunnen ook lager worden als de prijs van fossiel stijgt. Een windaandeel op zee is in ieder geval veel goedkoper dan de kernenergie uit de nieuw te bouwen centrales in de UK.
De invloed van windmolens op ons klimaat
“Grootschalig gebruik van windenergie kan het klimaat danig in de war schoppen.
De interactie tussen de hogere en lagere luchtlagen, als gevolg van het draaien van de wieken, zorgt ervoor dat een deel van de door windmolens gebruikte windenergie opnieuw wordt aangevuld vanuit de hogere luchtlagen.
Deze interactie heeft een ingrijpende ontregeling van het klimaat tot gevolg.
Maar dat niet alleen.
Ook de windsnelheid achter de windparken zal verminderen als gevolg van het onttrekken van energie aan de wind door windmolens.
Met name in landen die aan zee liggen, Nederland, België en Denemarken, kan daardoor de neerslaghoeveelheid toenemen. De toenemende neerslag in Nederland wordt nu toegeschreven aan de klimaatsveranderingen en opwarming van de aarde, maar is dat wel zo? De invloed van windmolenparken voor de kust wordt namelijk schromelijk onderschat.”
En meer…
http://www.fibronot.nl/page_id1110/
Anne
Kortom, nog maar eens goed onafhankelijk onderzoek doen. Dat kost wat, maar het is beter dan molenwiekend als gekken je gelijk je halen. En inmiddels staan er meer dan genoeg molens om dat onderzoek te doen. Daarvoor hoeft er niet één meer bij. En waarvoor wél? ook dat is allerminst duidelijk, zelfs extreem twijfelachtig geworden.
Ik denk inderdaad dat de invloed van windmolens op het klimaat wel beter onderzocht kan worden. Die zal er zeker zijn. Maar dat ze een ‘ingrijpende ontregeling’ veroorzaken lijkt me sterk. Ook veroorzaken ze geen opwarming, met de veroorzaakte luchtbeweging herverdelen ze de warmte. Dat is hier al vaak besproken. Ik zou ook niet weten waardoor ze meer neerslag veroorzaken. Hoogstens schuiven de neerslagpatronen ietsje op doordat de invloed van de zee wat minder boven land doordringt (als dat al zo is).
Jammer genoeg zijn er weinig of geen goede (lange) meetreeksen van windrichting en windkracht in Nederland. De metingen worden beïnvloed voor veranderingen in de meetopstelling, en veranderingen in de omgeving.
@ Bart Vreeken
We hebben ruim 30 jaar een per saldo sterk positieve NAO (North Atlantic Oscilation). Effect daarvan is veel Atlantische wind richting de Noordzee.
Nu vol inzetten op wind is economische zelfmoord op landelijk niveau. Door politiek beleid te voeren zonder naar natuurlijke trends te kijken.
Als we langdurig een negatieve fase krijgen zoals vaak is voorgekomen zijn er langdurig weinig Atlantische winden, en minder sterk, een windstille periode.
Zuid Europa krijgt dan juist meer wind, maar dat terzijde.
http://appinsys.com/globalwarming/AO_NAO_files/image001.jpg
Hier een historische weergave van de NAO. Tussen 1940 en 1970 was deze negatief. Als zo’n periode straks weer komt gaan alle parken failliet en zitten we allen al uit die hoek met honderden miljarden verliezen.
https://upload.wikimedia.org/wikipedia/commons/a/a3/Winter-NAO-Index.png
@MP, Historische windkracht gegevens zijn beschikbaar. Niets wijst op grote variaties op de Noordzee. Evengoed: Het is een ondernemers risico. Als morgen het gouden ei en de heilige graal worden uitgevonden dan sluiten de windparken ook. Het is een ondernemersrisico. De burger heeft daar verder niets mee te maken. Het is een ondernemersrisico. Als de olieprijs in elkaar stort is dat ook een ramp voor de Noordzee olie. De hele offshore industrie ligt dan op zijn gat. Dat gebeurt regelmatig. Wat merk jij daar als burger van?
De invloed van windmolens, en alle andere bouwsels en activiteiten van de Mens, is grootteordes te klein t.o.v. de invloed van die grote gele bol in de lucht en die grote blauwe massa her en der op aarde om ook maar enige langdurige, definitieve, meetbare invloed te hebben op ons klimaat.
Als hybris nog niet ware uitgevonden door Icarus, zouden we het hier moeten doen.
Of helemaal niet bouwen ….
Zijn de Denen nu helemaal gek geworden?
Ze geen grote eilanden bouwen voor hun kust.
Straks stijgt de zee 7 meter, eilanden weg, foetsie.
Of zijn de Denen zo slim dat ze nu al weten dat die spiegel hooguit maar een paar millimeter stijgt of totaal niet.
Nee verdorie hij stijgt want ze bouwen eilanden, dus minder plaats voor de zee!
Zal dit wel goed komen? :-)
https://datanews.knack.be/ict/nieuws/denemarken-wil-europees-silicon-valley-bouwen-op-kunstmatige-eilanden/article-normal-1414529.html?cookie_check=1546967363
“Nee verdorie hij stijgt want ze bouwen eilanden, dus minder plaats voor de zee!
Zal dit wel goed komen?”
Nou, als je dan zo precies wilt kijken dan heb ik goed nieuws. De grond voor de eilanden komt waarschijnlijk van de zeebodem. Een deel van de eilanden steekt boven het water uit. Dus netto een ietsiepietsie minder stijging van de zeespiegel. :-)
@Bart,
Je hebt gelijk, dan hebben we ook gelijk de stijgende zeespiegel die maar niet wil stijgen. We gaan gewoon veel gaten in zee maken, dan stijgt die niet, (Toch) :-)
Goed zoeken waar de stop van dat afvoerputje nu toch verstopt zit.
Ja precies, super goed idee van jou!
“Hernieuwbare energie leidt niet tot vermindering CO2–uitstoot”
Behalve dan dat al die energie die werd bekomen door wind/zon/water/…, niet tot CO2-uitstoot heeft geleid. Indien die energie met fossiel was opgewekt, dan zou er nog veel meer CO2 in de lucht zitten!
Maar zo mag je het volgens de overtuiging van de populisten natuurlijk niet bekijken!
“Grappig is dat de verhoogde CO2–uitstoot niet gepaard is gegaan met een stijging van de temperatuur. Die is de laatste twee jaar fors gedaald.”
Blijkbaar leest Hans Labohm niet de reacties op zijn eigen blog. Of weigert hij om eens na te denken over wat daar staat en ook maar enig voortschrijdend inzicht te tonen. De –in zijn ogen- ‘forse daling’ is immers gewoon ruis op een stijgende curve. Er is dus geen ‘forse daling’ en er is wel degelijk een ‘stijging van de temperatuur’, met daarop heel wat ruis. Zie http://www.climategate.nl/2019/01/gemiddelde-wereldtemperatuur-daalt-nu-twee-jaar-op-rij/comment-page-1/#comment-2229017
2017 en 2018 zijn trouwens nog steeds één van de warmste jaren in de afgelopen 2000 jaar.
“Men moet er dan ook voor hebben doorgeleerd om uit deze metingen te concluderen dat CO2, en in het bijzonder door de mens uitgestoten CO2, een dominante invloed uitoefent op de gemiddelde wereldtemperatuur.”
Als dat je standpunt is, trek er dan ook de logische conclusie uit: trek dan niet zelf domme conclusies over “fors gedaald”, maar aanvaard dan wat de mensen die hebben doorgeleerd (de klimaatwetenschappers) concluderen: er is een stijging in temperatuur, die is in hoofdzaak door AGW, en die zal zich blijven doorzetten in de volgende decennia en mogelijks volgende eeuwen.
Deze zin ga ik in ieder geval wel onthouden, Hans Labohm… Het is een mooi voorbeeld van wat de Engelsen beschrijven als “shooting yourself in the foot”!
Dit Deense rapport schat de Nederlandse KwH prijs op 55.4 cent, in 2030 (pagina 49)
https://www.danskenergi.dk/sites/danskenergi.dk/files/media/dokumenter/2018-06/Electricity_Price_Outlook_2018.pdf
Als de EU zone versneld van alle kolen afgaat en vervangt door gas kan dat nog veel meer worden. Een zelf gestuurde gasprijs crisis, met nog hogere KwH prijs als gevolg.
@MP, Dat is de prijs in MwH in hele Euro’s is het dan niet 5,5 cent voor een KwH?
Niemand kan er toch tegen zijn van woningen beter te isoleren en los van de opwarming moet
er toch een transitie gebeuren want het Nederlands raak op wel eens op ook de kostbare olie
zal plots op raken en dat kan wel eens sneller gebeuren dan gedacht dus is het zeker niet slecht om zo snel mogelijk alles hier op aan te passen en te kiezen voor elektriciteit tot de (hopelijke) komst van Thoriumcentrales !
Dave B: Olie raakt nooit op. Wel zal er een punt bereikt worden dat het meer dan een liter olie kost om een liter olie op te pompen. Maar doordat zon- en windenergie steeds meer energie gaan opleveren dan dat het kost (de producenten stellen namelijk dat de terugverdientijd van die apparaten korter is dan de levensduur, waardoor de apparaten uiteindelijk dus meer energie afleveren als dat er ooit ingestopt is!), kunnen we olie op blijven pompen, maar dan dus d.m.v. zon- en windenergie.
Het isoleren van woningen kost ook energie. Het isolatiemateriaal moet namelijk geproduceerd worden (uit olie) en bij de productie komt warmte en CO2 vrij (en nog veel meer ‘giftige’ zaken). Als je pech hebt is op een dag het isolatiemateriaal niet meer isolerend, bijvoorbeeld doordat het door condensvorming nat is geworden. Na die dag ga je extra stookkosten krijgen.
Overigens wordt de lucht in oudere, na-geïsoleerde woningen slecht ververst (logisch anders waait je warmte letterlijk weer het huis uit). Die slecht ververste lucht zal vochtiger zijn, waardoor er weer meer energie nodig is om die vochtige lucht te verwarmen. Voordat je aan het isoleren slaat, moet je goed onderzoeken welke methode het beste is en waarbij de terugverdientijd binnen de levensduur van de isolatie ligt. Anders heeft het financieel en milieutechnisch geen zin. Uiteraard kan de overheid de prijzen van fossiele brandstoffen onmogelijk duur maken door het heffen van idioot hoge belastingen (eigenlijk doen ze dat al), maar dat heeft niets met marktwerking te maken, wel alles met centraal geleide planeconomie. Ik hoor de begintonen van de Internationale’ al inzetten bij veel politici…
In deze discussie lees ik meerdere reacties over duurzame energie, zowel voor als tegen. Om te beginnen wil ik eerst even zeggen, dat ik dat hele verhaal over CO₂, zoals dat tegenwoordig overal door de media en de overheden verteld wordt, zelf ook jarenlang geloofd heb, want de temperatuur stijgt en er komt steeds meer CO₂ terecht in de atmosfeer. En als je dan die film kijkt van Al Gore, dan slaat de schrik je om het hart. Ik wilde best wel mijn steentje bijdragen aan het milieu, en daarom ruilde ik mijn bijna 9 jaar oude auto in 2010 in, om er een zeer zuinige hybride voor in de plaats te kopen. Mijn dak was al deels gevuld met zonnepanelen, en onder de begane grond vloer had ik de bestaande vloerisolatie van extra isolatiemateriaal voorzien in de vorm van TonZon, zodat de isolatie nu zelfs nog beter is dan de nieuwste norm. Daarna heb ik het resterende deel van mijn dak verder opgevuld met nog meer zonnepanelen. Inmiddels las ik een artikel over de rol van CO₂ bij de opwarming van het klimaat, of, beter gezegd, de veronderstelde opwarming dan, omdat hier een heel ander verhaal werd verteld. En nu ben ik dus een ongelovige geworden, althans, wat het verhaal over de CO₂ betreft. Dat het klimaat nu warmer is dan een tijdje terug zal ik zeker niet ontkennen, dat kan ik immers ook uit eigen waarnemingen vaststellen. Maar met CO₂ heeft dat niets te maken. Tijdens een deel van de Romeinse Tijd, en tevens een deel van de Middeleeuwen, was het klimaat zelfs nog iets warmer dan nu. En als CO₂ nu de oorzaak zou zijn van de opwarming van het klimaat, dan zou het nu zelfs nog warmer dan destijds moeten zijn. Vroeger waren er geen auto’s, vliegtuigen of kolencentrales, dus hoe kan het dan tijdens bovengenoemde periodes dan in vredesnaam nog warmer zijn geweest dan nu? Dat klopt dus niet, de natuurwetten zijn ook tegenwoordig hetzelfde als toen. Ze maken mij dus niet meer wijs, dat de opwarming van het klimaat door de uitstoot van CO₂ zou komen, want als dat waar zou zijn, had het klimaat tijdens bovengenoemde periodes dus juist kouder moeten zijn. De totale hoeveelheid CO₂ bedraagt 0,04%, waarvan slechts een kwart afkomstig is van menselijke activiteiten. Maar waarom wordt dat hele CO₂ verhaal dan toch zo zorgvuldig in stand gehouden door onze overheden? Zou het kunnen zijn, dat men dan een mooi excuus heeft om ons opmte zadelen met hogere belastingen, zoals inmiddels al inderdaad gebeurt? Waarom wordt er in publicaties over CO₂ en ons klimaat altijd gesproken over zoveel miljoenen tonnen CO₂, en nooit over percentages? Als 0,01%, een kwart van de aanwezige 0,04% door ons wordt veroorzaakt, dan kan zo’n extreem kleine hoeveelheid CO₂ onmogelijk ons klimaat op hol laten slaan. Als ik zou beweren, dat een cruise schip zou zinken als er een meeuw op neerstrijkt, vanwege het gewicht, dan zou toch niemand dit serieus nemen? Wat zou dan de oorzaak zijn van de opwarming van het klimaat? De zon heeft ook periodes van meer of minder activiteit, en dat heeft invloed op de instraling van de warmte. En wat zijn eigenlijk de gevolgen van de massale houtkap in sommige landen in de tropen? Daar wel eens aan gedacht?
Maar toch lees ik hier ook, dat windturbines of zonnepanelen geen nut zouden hebben, althans in sommige reacties dan. Volgens mij klopt hier niets van, want ik produceer meer elektriciteit dan dat ik verbruik. Het afgelopen jaar heb ik 1060 kWh méér geproduceerd dan mijn verbruik. Als ik het geld dat ik in mijn zonnepanelen heb geïnvesteerd op de bank zou hebben laten staan, vang ik hooguit 0,5% rente. Mijn rendement op de zonnepanelen bedraagt ongeveer 6% of iets daarboven. Mijn overschot van de zomer verreken ik met mijn hogere afname in de winter, salderen heet dat, maar uiterlijk in 2021 zal de salderingsregeling vervangen worden door een soort teruglever subsidie, die helaas ongunstiger is dan de salderingsregeling zoals die nu nog van toepassing is. De stroom die bij mij het net ingaat, komt terecht bij de huizen bij mij in de straat, via de meters daar. Dat is extra gunstig, omdat deze elektriciteit niet via lange verbindingen getransporteerd wordt. Gemiddels gaat er ongeveer 7% verloren tussen de energiecentrale en de verbruiker, dat komt door verliezen in de hoogspanningskabels over lange afstanden, en de transformatie verliezen, omdat het nu eenmaal niet handig is om 300.000 volt uit je stopcontact te krijgen. Deze verliezen hangen natuurlijk wel af van de afstand, maar gemiddeld is dat dus zo’n 7%. Die verliezen zijn er niet bij zonnestroom die ter plaatse wordt verbruikt. Zonnepanelen zijn in Nederland dus wel degelijk rendabel, al helemaal met de steeds goedkoper geworden zonnepanelen nu. Dus laat de salderingsregeling nou maar gewoon blijven.
En dan moeten we van het gas af? Onzin! Een hoogrendements ketel haalt 95% rendement, terwijl een elektriciteitscentrales slechts 46% haalt. Maar wie een warmtepomp moet nemen gaat zijn verbruik van stroom meer dan verdubbelen!!!
Conclusie: ze zijn in Den Haag gewoon gek geworden, en onze regering geeft dus de aanzet tot een enorme kapitaalsvernietiging. Geen gas meer uit Groningen snap ik, geen gas meer willen kopen bij Putin, snap ik. Maar dit jaar wordt begonnen met de aanleg van een pijpleiding van Israël, via Cyprus, Griekenland en Italië naar Europa. Israël heeft een ontzagwekkende voorraad aardgas in de bodem voor de kust liggen, zo’n beetje de grootste aargasbel op aarde! Straks kunnen we daar dus aardgas kopen tegen een gunstiger prijs dan uit Rusland. Is Den Haag wel op de hoogte???????
Ik heb een vraag, danwel wil me graag wat inlezen/linkjes vwb. CO2 stellingnames en de beoogde 49% reductie ervan. (Rond 1975 maakte ik bij mijn landbouwonderwijs/fytopathologie kennis met grafieken, curvelijnen, ppm’s en geldsmijterij in ‘de wet van de afnemende meeropbrengst’ e.d. Heb die kennis later niet zoveel meer hoeven toepassen maar knaagt er nu wat):
Kortgeleden las ik dat het broeikasEffect van elke nieuwe CO2 molecule steeds kleiner wordt (asymptotische curve?!). Hoe meer de wereld hout opstookt hoe minder toename ‘ernstig’ effect?
Hoe verhoudt reductie zich tot (tja wat is nieuwe) CO2 toename vraag ik me af.
Werkt dit omgekeerd ook? Of is het allemaal geneuzel vèr achter de komma…
Eigenlijk bedoel ik sceptisch en eenvoudig: Hoeveel hout snijdt het beleid bij reductiebereik 49%, of ‘op 40% voor mijn part’ zoals Hermie onlangs aangaf, danwel met alle pogingen komen we in NL ‘maar’ uit op 20%….in bijkomende effecten van verminderd verlaagd.
@J.M.Schipper, Het effect van toename CO2 wordt inderdaad steeds kleiner zodra je het hebt over een concentratie boven de 2%. Zover zijn we nog lang niet. Vraag het aan Hans Erren, die kan die vraag uitstekend beantwoorden.
@Schipper, wat Hermie zegt klopt niet helemaal. De toename van de temperatuur als functie van toename van CO2 verloopt logaritmisch. Dat bedoel je wellicht met “Kortgeleden las ik dat het broeikasEffect van elke nieuwe CO2 molecule steeds kleiner wordt (asymptotische curve?!)”
Laat maar weten als je meer wilt weten.
@Ronald, Dan ben je nog mild. Wat ik opschreef sloeg helemaal nergens op. Met de kromme erbij wordt het snel duidelijk. Boven de 2000 ppm zie je geen effect meer. Maar beter inzoomen tussen 300 – 800 ppm Daar hebben wij mee te maken. Dan zie je bij benadering een rechte lijn.
…..Om vervolgens een paar nullen te vergeten. Verzadiging dus pas bij 2%