
Lars Løkke Rasmussen. PM Denmark.
This letter has originally been written by the Danish geologist, prof. em. dr. Johannes Krüger, and was addressed to the Danish Prime Minister, Lars Løkke Rasmussen. Subsequently, the letter has been translated into Norwegian and – with slight amendments – addressed to the Norwegian Prime Minister, Erna Solberg, together with signatures of 20 Norwegian scientist, all climate realists.
A Dutch translation of the Norwegian version has been published on Climategate.nl here.
Afs. Johannes Krüger
Professor emeritus, dr. scient.
Institut for Geovidenskab og Naturforvaltning
Københavns Universitet
Geocenter Danmark
Øster Voldgade 10
DK-1350 Copenhagen K
12 March, 2019
Statsminister Lars Løkke Rasmussen,
The media are awash with reports about failure of the health system, abuse of social funds and other similar reports. They have often come to light because journalists were determined to ask the right questions. Most recently, three journalists received the Cavling Prize for the disclosure of the involvement of the Danish Bank in a € 200 bn money laundering scandal.
But when climate change and global warming are concerned, the media refuse to engage in in-depth journalism. They almost exclusively rely on so–called climate experts, who pretend to represent the entire scientific community. There are several examples of extreme pronouncements about climate change that are uncritically parroted by the media, or that journalists use the media as a platform for climate campaigning and activism. For example, when a debate moderator categorically rejected a serious counter–argument to ‘Climate realism is shirking responsibility’ (in Kristeligt Dagblads Ethisk set, 4 February, 2019). In doing so, the rules for good media ethics were violated. Media attention is almost exclusively focused on those who support the claims of UN’s IPCC (Intergovernmental Panel on Climate Change).
The issue of the cause of today’s climate change and its many implications, is much more controversial than is being represented by the IPCC and the news media. Because the scientific measurements and observations show something which is quite different from the outcome of the inadequate computer–generated climate models. But politicians are incapable to understand this information and to use it as basis for rational decision–making, because they ignore relevant insights. This is due to the fact that the political environment, like the media world, is strongly biased by groupthink and self–censorship.
I was shocked when a 9th grade student told me that he had chosen to write a composition on the severely limited freedom of speech in the climate debate (everyone else in the class wrote about the ‘harmful’ impact of CO2). The gifted student had an interview with one of the climate spokesmen at Christiansborg (Danish Parliament) about global warming, and he had been appalled by the fact that the politician in question could only portray the emission of CO2 as pure evil.
Therefore, I turn to you and other selected politicians, in the hope that you will spend some time on reading the following, which I am sure will provide useful food for thought. We are facing a parliamentary election, where the climate issue is on the agenda and it needs a thorough overhaul.
The reluctance of the media and politicians to inform themselves of the results of international research that are inconsistent with the message of the IPCC, is certainly reinforced by the repeated propagation of unsustainable claim that 97% of climate scientists agree that most of global warming is man–made (called AGW = Anthropogenic Global Warming), and will have catastrophic consequences for the planet, if we do not act.
The 97% consensus claim has been promulgated by the media as if all global warming is man–made. The figure originates in particular from an article by J. Cook et al. (2013): ‘Quantifying the consensus on anthropogenic global warming in the scientific literature’, in which the authors have classified 11,944 summaries of articles on global climate change and global warming into four categories. Of these summaries, 7,930 did not take any stance on AGW and were sorted out, 3,896 joined the claim of AGW, while 118 rejected it or expressed doubts. Against this background, Cook et al conclude that 97% of the climate scientists support the AGW hypothesis.
This story, that actually does not deserve a place in a serious climate debate, is the focus of B. Shollenberger in: ‘The Climate Wars – how the consensus is enforced’, and by A. Montford in: ‘Fraud, bias and public relations – the 97% consensus and its critics‘. Cook’s article is misleading. Partly because it is unacceptable to discard 7,930 relevant climate papers, and partly because Cook’s data – access to which for examination was initially refused because it was said that the computer had broken down – revealed that there were actually only 41 articles that unconditionally supported the claim of AGW. For it turned out that the group of 3,896, who apparently supported the claim of AGW, also included the scientists who believe that man contributes only 20–30% to global warming and – what is worse – even so–called skeptics, who believe that the human contribution is only a few percent. A security failure on a web–page revealed that Cook’s article was originally targeted at the media – and it was indeed – to use uncritical journalists as messengers. But Cook’s article is manipulative. It is like making a mountain out of a mole hill.
The 97% consensus claim is still lurking around and is not only used to dismiss skeptics and block any serious climate debate, but also to create a scientific alibi for political decision–making. Former Norwegian Prime Minister Gro Harlem Brundtland has stated: ‘In the climate case it is immoral to doubt’. But doubt is precisely the hallmark of science, while anti–skepticism is pseudoscience and challenges the freedom of speech and a healthy democracy.
Many perceive the IPCC as the oracle of climate change. But the IPCC is a political organization, appointed by politicians and with a mandate to give politicians advice on ‘climate policy’ in connection with human emissions of CO2. Rupert Darwall has studied the origines of the IPCC. His conclusion: The IPCC is an organisation which is reviewing itself. Politicians exercise control over its scientific reports that must underpin and, at the same time, provide an alibi for political decision–making. They dictate the conclusions of the Summary for Policymakers, which is targetted at politicians and news media. The scientists who dominate the IPCC process, therefore, behave more like politicians than as independent scientists, and are well aware that there are serious problems with their data and conclusions.
That has been revealed by Chris Landsea in an open letter, when he withdrew from his lead authorship in the IPCC, in protest over the IPCC’s handling of the issue of storm activity, which ‘is based on prefabricated agendas and is scientifically unreliable’. And it was also evident from the leaked emails of the so–called Climategate in 2009, a scandal that was subsequently cleverly swept under the carpet.
Thus, politics, science and special interests are mixed together into a dangerous cocktail, which has led to widespread group think and self–censorship. 154 Governments signed the Rio Declaration in 1992, which, on a very flimsy scientific basis, stated that human emissions of CO2 are the cause of global warming. This is the origin of a climate policy agenda and something completely unheard of: the predetermined conclusion of scientific investigation. Since then, the IPCC has contributed to a growing politicization of a scientific discipline. The entire climate and energy policy agenda is based on this view – that CO2 is the culprit. Reconsideration of what has happened is, therefore, an important social task, if one wants to strengthen enlightened democracy.
Hereafter some concrete examples are being offered of factual observations and robust research results, that are inconvenient for the IPCC, and of which politicians and the public are, therefore, not aware. It is not an overview of emotionally–charged letters, contributions to the heated debate or the impact of climate alarmism on children, grandchildren and the hopeless future of our planet. It focuses on observations and facts, instead.
‘Hot spot’ – human fingerprint on global warming!
In IPCC’s 2007 report, it is argued that increasing emissions of greenhouse gases are the cause of global warming, and that the models show that the warming would manifest itself in a ‘hot spot’ in a wide area at a height of 8–12 km above the equator. It is assumed that because of the increased CO2 concentration in the atmosphere, the balance between short–wave solar radiation and the long–wave outgoing radiation from Earth will move to a higher level higher in the atmosphere into a colder layer. This layer is subsequently warmed up to maintain the balance. According to the models, the atmosphere above the equator should be heated almost twice as fast as the earth’s surface below, which would give rise to the development of a ‘hot spot’ in the upper troposphere. However, as illustrated in Figure 1, the predicted heating does not correspond to reality. Data from balloons since 1958, and satellites since 1979, show much less temperature rise at higher altitudes than at ground level. So, what, according to the IPCC, should be a clear signal of the alarming effect of anthropogenic emission of CO2, fails to show up.
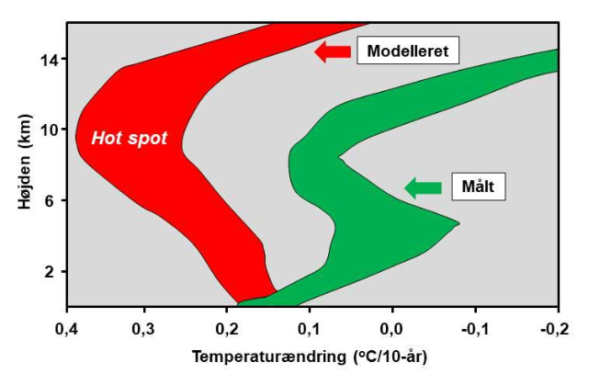
Figure 1. A crucial point in the CO2 hypothesis assumes that the atmosphere at 8–12 km above the tropics is heated approximately twice as fast as the ground surface below, and that it will create a ‘hot spot’. But as is shown in the figure there is a considerable gap between the outcome of IPCC’s climate models and reality. Source: Douglas et al. International Journal of Climatology 2008. Graphics: O. Humlum.
Errors and uncertainties in IPCC’s climate models
The climate models used by the IPCC project predict drastic global temperature increases, sea level rise and other harmful effects over the next 100 years, due to human emissions of CO2. The IPCC claims that the entire temperature rise after 1970 can be attributed to an increased greenhouse effect, in the absence of which the temperature would have been decreasing. But it is pseudoscience when the IPCC claims that the climate models are right, because they do not take account of significant aspects of the complex climate system and, therefore, have never matched the observed temperatures. Consequently many researchers believe that natural climate variations remain the driving forces behind global climate change.
In order to be able to use a climate model as the basis for political decision–making, one must make sure that a model includes all the main determinants in the complex climate system. Scientists around the world can provide a long list of physical and chemical processes that are not fully understood, and which are, therefore, either omitted in the climate models or inadequately represented. Therefore, they fail to match the observed data. This applies, for example, to cloud formation that takes place on a spatial scale, which is far too small than even super–computers can handle. It also applies to many of the climate system’s natural fluctuations on a long time scale and problems simulating such an important climate element as the Earth’s radiation balance.
There is also uncertainty regarding the importance of the atmosphere’s aerosol concentration. These dust grains can increase the albedo of the sun’s radiation and cause the Earth to cool. But aerosols can also absorb heat from sun rays, thus preventing the formation of clouds. Many of these processes are not sufficiently quantified and belong, therefore, to some of the greatest challenges for climate modelers. The modelers themselves, of course, are well aware of the limitations of their models, but political decision–makers and the public are unaware of it.

Figure 2. Both James Hansen’s model and the model in the IPCC’s 3rd report from 2001 deviate from observations, which are represented by the green curve. It shows the trend in the annual global temperature 1980–2014 as a moving average of the monthly average values from the three most widely used data sets. There is a gradual rise in temperature until around 2002, after which the rise in the global temperature stops. Source: University of Alabama at Huntsville, USA (UAH), Remote Sensing System, USA (RSS) and Hadley Center for Climate Prediction and Research at the University of East Anglia’s Climate Research Unit, UK (HadCRUT).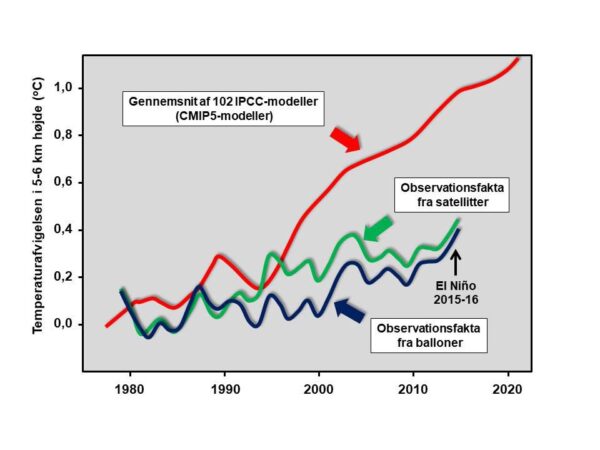 Figure 3. Comparison between observations from balloons and satellites and the average of 102 climate models’ temperature deviation from the 1979 temperature at 5–6 km above the tropics for the period 1979–2016. The figure was presented by atmospheric researcher John Christy during a Senate hearing in the House of Representatives, USA. Source: J.R. Christy 2017: Assumptions, policy implications, and the scientific method. Climate Science.
Therefore, as shown in Figure 2, none of the IPCC’s climate models has been able to project the actual global temperatures. Another projection, which also fails, is shown in Figure 3. It shows a simplified version of a graph presented by US atmospheric scientists J. Christy during a Senate hearing in the House of Representatives in the United States on 29 March 2017, questioning the validity of the IPCC’s climate models. It shows an increasing divergence between models and observations. None of the IPCC’s climate models has projected the ‘warming pause’ since 2000.
Hocus pocus with climate data
In 2014, the national NCDC (National Climate Data Center) broke its record in misleading the public. It concerns the temperature in the US during the period 1895–2014. In figure 4, left, the average temperature is shown, based on the original temperature data. Accessing the original data is often a problem, either because it has been deleted, supposedly due to lack of space, or because the computer that has been used for data processing, has crashed. The graph shows that there has been no temperature increase in the US over the past 90 years. The rise in temperature that we have witnessed in the 1980s and 1990s is similar to that which occurred in the 1930s and 1940s. Figure 4, right, shows the same temperature series, but adjusted by the NCDC. It is this curve of the annual average temperature in the United States that the NCDC has published. Temperatures before 2003 were adjusted downwards, while those after 2003 were adjusted upwards, in order to make them consistent with the climate policy agenda. Conclusion: climate data has been subject to hocus pocus and gross manipulation.

Figure 4. The curve on the left shows the annual mean temperature for the USA in the period 1895–2014, based on the original data. Source: The National Climatic Data Center (NCDC). The curve on the right shows the adjusted annual mean temperature for the United States. The temperatures before 2003 have been adjusted downward, while those of the years after 2003 have been adjusted upward. Source: The National Climatic Data Center.
Global temperatures have been manipulated as well. The official temperature curve developed by NOAA (National Oceanic and Atmospheric Administration) of the global temperature for the period 1900–1999, which the IPCC has presented in its reports, has been extensively adjusted to show a much higher temperature rise than the original temperature data indicates. As Figure 5 shows, the adjustment contributes up to 0.3oC of the postulated global warming of 0.7–0.8oC during the 20th century. The conclusion is, therefore, that the global temperature has increased between 0.4oC and 0.7oC, where the first number is based on original temperature series and the last on adjusted and manipulated data. None of these values are alarming in any way.
On Sunday, February 5, 2017, the world witnessed a sequel of the Climategate scandal, when it became clear that a revolutionary article in the reputable scientific journal Science was based on erroneous data and has been rushed through the publishing process, apparently to influence international climate diplomacy. The article’s main author was Thomas Karl, then one of the leading researchers in NOAA, the world’s leading organization for collecting climate data. In the article, it was claimed that the global warming pause (‘hiatus’) since 1998 had not existed and that the temperature had increased faster than the researchers had expected. Not only did the news go around the world, but it was also grist to the IPCC mill, because in its fifth main report of 2013, the IPCC acknowledged that the long–term pause in global warming was real. The following year, this was confirmed by both NASA and NOAA, but without a plausible explanation.
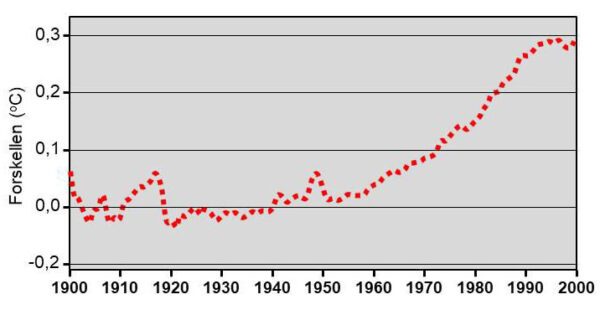
Figure 5. The curve shows the extent of NOAA’s adjustments to the global temperature for the period 1900-1999, ie. the adjusted data series subtracted from the original temperature measurement series. Note that the adjustment creates an artificial contribution of 0.3oC to the temperature rise in the late 1900s. Source: National Oceanic and Atmospheric Administration NOAA.
The alleged rise in temperature in Thomas Karl’s ‘denial of the hiatus’ article was based on temperature data from 3000 ARGO buoys in the oceans. But these were adjusted upwards to make them ‘homogeneous’ with the longer–running, but less reliable, temperature records taken from engine intake channels in marine vessels. In addition, Thomas Karl had ignored NOAA’s own rules for quality control and publication. This has been acknowledged by NOAA’s management, as the former climate scientist at NOAA, John Bates, has declared. He revealed the story behind the ‘denial of the hiatus’ article in The Daily Mail. It has proved impossible for other researchers to check Thomas Karl’s work, because the data in question have not been archived. But the damage had happened. The ‘denial of the hiatus’ article offered a perfect scientific alibi for far–reaching political decisions.
Is the hot, dry 2018 summer in Denmark caused by global warming?
Many partial explanations of this phenomenon have been published. The extreme 2018 summer will certainly be remembered as the warmest and driest period in ‘people’s memory’. Not only Denmark, but also large parts of Europe were affected. It is understandable that the heat and drought, which have inflicted severe damage on agriculture, was perceived as a result of global warming. The media reported it, and powerful interest groups exploited the situation to once again promote the ‘fight against climate change’. The media have frightened children and young people, who demonstrated in the streets of Europe’s big cities – and the media has thrown oil on the fire. Watching the 16–year–old Swedish girl Greta Thunberg’s appearance on TV is tragic. The United States and Central Asia also experienced a hot summer. But at the same time it was – as illustrated in Figure 6 – unusually cold for the time of the year in eastern Canada and in Greenland, where cold records were broken, as was the case in eastern Asia.
But the extremely dry and hot summer can be explained by the atmospheric phenomenon of the polar jet stream, which at times is heavily meandering which causes redistributes of heat and cold and contributes to creating regional heat and cold records. The fact is that the global average temperature for the period June–July was slightly below the average of the previous decade – a fact that is easily ignored by the media and so–called climate experts. Meandering of the polar jet stream is not new. In the past, periods of 20–30 years with more frequent fluctuations in the polar jet stream, with dominant north–south winds, interrupted by periods of similar length with fewer fluctuations and more frequent west–east winds, are well known.
The extreme weather in the summer of 2018 in Denmark was not a caused by global warming, but must remind us that we live in a local or regional climate – not in a global climate. In retrospect, figures from DMI (Danish Meteorological Institute) – as illustrated in Figure 7 – show that the temperature has not increased in Denmark over the past couple of decades, but the public is not aware of that.
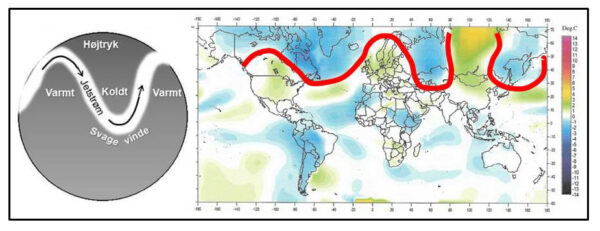
Figure 6. The belt along the path of the jet stream, where, in June 2018, there were lower or higher temperatures compared to the average temperature for the month in question, over the past 10 years. Data source: Goddard Institute for Space Studies (GISS).
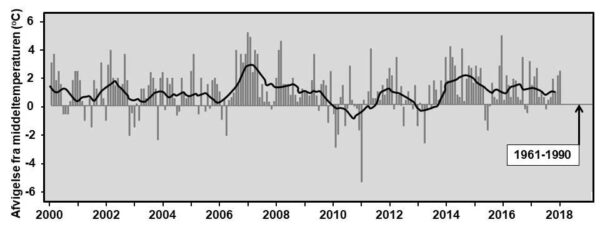
Figure 7. The columns show the monthly temperature deviation from the latest official climate standard 1961-1990 (mean temperature 7.7 oC) in Denmark for the period 2000-2017. The curve shows the moving mean. As is the case globally, the temperature in Denmark has not increased in the last couple of decades. Data source: DMI.
Water vapor is the most important greenhouse gas
The IPCC suggest that CO2 is the dominant greenhouse gas, but the IPCC’s greenhouse concept is a misleading simplification. In its reports, the IPCC omits crucial aspects of the greenhouse effect, which would otherwise reveal the CO2–greenhouse gas’s very limited impact on the climate. The importance of CO2 as a greenhouse gas is greatly exaggerated, because, in fact, water vapor is the dominant greenhouse gas. But unlike CO2, water vapor increases cloud formation and thus cooling.
In brief, and without being too technical, the explanation is as follows. When the sun heats the earth’s surface, much of the heat is absorbed for evaporation of water, which, accounts for more than 70% of the Earth’s surface. Like CO2, the invisible water vapor is a greenhouse gas, because it is capable of absorbing the infrared, long–wave, backward radiation from the Earth. While CO2 and likewise methane are only able to absorb the long–wave radiation within a very narrow band of the wave spectrum, water vapor – as shown in Figure 8 – can absorb the back–radiation in almost the entire spectrum of infrared light, also those parts of the wave spectrum covered by CO2 and methane. Therefore, water vapor is also capable of absorbing most of the infrared back–radiation from the earth’s surface before reaching the higher–lying infrared–active CO2 molecules, as well as the rays emitted by CO2 back to Earth. These processes help to reduce the impact of the increase in atmospheric CO2 that has occurred since the 1970s.
The actual CO2 concentration is well over 400 ppm, while the average water vapor concentration is estimated to be about 4000 ppm. Both because of the molecular properties of water vapor and the large amounts of water vapor in the atmosphere, water vapor is the dominant greenhouse gas. According to DMI, water vapor is the largest contributor to the greenhouse effect, as on average about 60% of the total radiation impact from greenhouse gases comes from water vapor. For comparison, it is almost 30% for CO2.
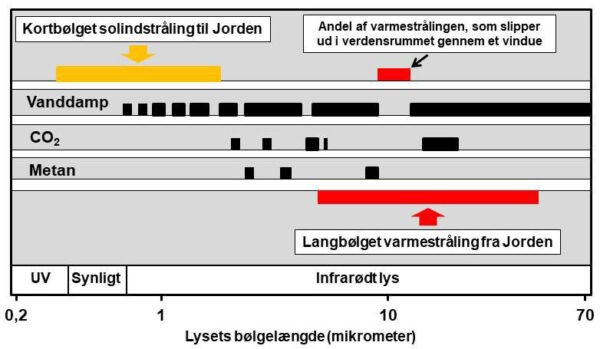
Figure 8. At the top left of this figure the wavelength spectrum of the solar radiation is shown through which radiation can pass and reach the Earth. At the bottom right is the spectrum of the heat radiation from Earth when the soil surface temperature is around its mean value of 15oC. In the tropics where the surface is warmer, the radiating area is shifted to the left (shorter wavelength). In the polar areas, it is shifted to the right. At the top right of the figure the wavelength range is shown, where radiation from the surface can pass through to the atmosphere into space. The black bars in the middle of the figure show the areas of the wave spectrum where water vapor, CO2 and methane, respectively, are able to absorb the long–wave radiation from Earth. It is clear that both CO2 and methane have marginal significance as greenhouse gases, while water vapor is the dominant greenhouse gas. Data source: Atmosphere physicist Ole Henrik Ellestad 2017.
Water vapor is the dominant greenhouse gas, but water vapor transfers the absorbed radiation into heat, which causes the water vapor to rise. According to atmospheric physicians, this convection is a central, but underestimated, element of the greenhouse mechanism. In fact, the convection is 10 times more effective than radiation and completely dominates the energy flow from Earth to space in the lower layers of the atmosphere. As the temperature drops through the troposphere, which forms the lower layer of the atmosphere, the water vapor is cooled and gradually condensed into clouds. Clouds account for 65 ± 3% of the planet’s surface and reflect approx. 20% of the incoming solar energy, because clouds have a white surface. The global cloud cover, therefore, acts as a huge parasol – like a cooling blanket that prevents the sun’s radiation from reaching the Earth’s surface and thus has a decisive effect on Earth’s climate.
By analyzing satellite images collected by the International Satellite Cloud Climatology Project, scientists have mapped and measured the low cloud coverage since 1983 and compared the result with changes in global temperature. As illustrated in Figure 9, a clear connection between the global cloud cover and the temperature has been demonstrated. The entire global warming at the end of the 20th century can be explained by a reduction in global cloud cover of 3%, and the breakdown of global warming over the past two decades coincides with a stable cloud cover.
 Figure 9. The interaction between changes in the total global cloud cover and changes in the global surface temperature 1983-2010. Source: Had-CRUT (temperature). International Satellite Cloud Climatology Project.
The IPCC fails to include the impact of such crucial thermodynamic and hydrological processes as convection and cloud formation, for it is simply not capable of calculating and translating it into computer language. And this is a major reason why climate models do not match observations of the real climate. The IPCC itself acknowledges that they have little understanding that cloud formation has a dominant effect on the global climate, but the public is unaware of this.
Will continued CO2 emissions lead to a global climate catastrophe?
A team of international scientists has warned that the world is already facing a global climate catastrophe which, in the long term, will create hot house conditions like in the Tertiary and Cretaceous, millions of years ago, due to uncontrollable domino effects in the complex climate system. And that this will happen even if CO2 emissions are reduced. This view has made a deep impression on politicians, not least on the Danish energy and climate minister Lars Christian Lilleholt, who demands international action. But is there any scientific evidence for catastrophic warning, or is this just one of a series of usual scare-mongering stories propagated by climate alarmists?
On August 7, 2018, in the news broadcasts on radio and on television, one could hear and watch a clearly shocked energy and climate minister, after he had read a recently published climate report. The report not only casted doubt on the 2–degree objective of the Paris Agreement, but also presented a gloomy picture of the future of the planet. ‘We know very well that we have a very big challenge ahead of us, which calls both national and, not least, international action,’ said the minister.
The report which the minister qualified as ominous, is an article: Trajectories of the Earth System in the Anthropocene, which a team of international scientists, led by climate theologian Will Steffen, published in the prominent scientific journal, Proceedings of the National Academy of Sciences (PNAS). The team had investigated the risk that self–reinforcing climatic feedbacks – a kind of uncontrollable domino effect – can push the Earth’s climate towards a critical threshold that – if exceeded – can cause the global temperature to run out control and turn the Earth into a hot house. It is quite shocking reading. But the article is based on the IPCC’s flawed models of the climate, of which the IPCC’s own reports acknowledge: ‘In climate research and modeling, we should recognize that we are dealing with a coupled non–linear chaotic system, and therefore that the long–term prediction of future climate states is not possible.’ Therefore, it should rather be considered to be a piece of science fiction, which should not shock ministers.
It might raise some suspicion that when a television journalist asked one of the co–authors of that article at a mini climate symposium at the University of Copenhagen in March 2009 prior to COP-15, whether CO2 is really the main culprit, the answer was: ‘All invited scientists agree.’
So far, the IPCC has not been able to demonstrate that atmospheric CO2 controls the global temperature, neither in the long run nor in the short run. Ice core data, on the other hand, show that CO2 is lagging behind the temperature, and new research shows that this also applies today. It is the temperature that controls CO2 and not the other way around. This is because a warm atmosphere can accommodate more CO2, which is outgassed from the oceans. In addition, the effect of CO2 as a greenhouse gas, decreases logarithmically with increased CO2 concentration. The effect simply flattens out. As can be seen in Figure 10, the climatic effect of an increased CO2 emission is so marginal that the human impact cannot be detected. Therefore, CO2 should not be considered a threat, but as an elixer of life. More CO2 produces a greener Earth, that can feed an increasing population – for many decades already, gardeners use CO2 in glasshouse horticulture in order to increase production.

Figure 10. Temperature rise due to increased CO2 emissions. The effect is greatest at small concentrations of CO2, whereas the effect at concentrations now at about 400 ppm or higher is marginal. If there is a massive reduction in atmospheric CO2 content to 140 ppm, all plant growth on Earth will cease. Source: Atmosphere physicist Ole Henrik Ellestad 2017 – based on Lambert & Beer’s Law.
In response to the claim that livestock is a problem for the climate, you called on Danish farmers at the meeting on Agriculture & Food in Herning on 7th–8th November, 2018: ‘Show that you also care about the planet, our children and the future.’ But agriculture does not have to join the climate hysteria – it is not based on scientific evidence, nor is there any evidence that veganism will have an impact on climate.
Does sea ice in the Arctic melt at galloping pace?
Sea ice and polar bears in the Arctic occupy an iconic position in the climate debate. If one may believe the climate models, the sea ice in the Arctic will disappear in the near future, and it is often emphasized in the media that it is a consequence of man–made global warming. It is assumed that the melting of sea ice is a self–reinforcing process that, according to the statements of climate alarmists, will reach a critical point where the sea ice will melt away at galloping pace – a process which risks to be irreversible. But is this really true?
In the 1920s and 1930s, when it was also relatively warm in the Arctic, there was also massive melting of sea ice. Nevertheless, the sea ice recovered during the following decades up to 1979, after which it began to dwindle again. As can be seen in Figure 11, the sea ice area in the Arctic has not been significantly reduced over the past decades – and certainly not at a galloping pace as it has been claimed.
Although the sea ice area has shrunk, there are more polar bears today than 40 years ago. The population is growing and now amounts to 25–30,000. This growth is partly due to the fact that the melting of sea ice has created larger areas with open water in summer and autumn, which has improved the polar bears’ living conditions. Open water in the summer has a positive effect on the entire food chain in Arctic waters. When ocean currents add nutrients from the Bering Sea and the Atlantic Ocean, open water helps to increase photosynthesis. Then the amount of plankton grows and thus the amount of polar cod, which is important source of food for the seals, which in turn offer food for the polar bears. Throughout the summer, the seals stay in open water. The seals, therefore, thrive when the ice breaks up early. The polar bears’ main nutritional period extends from late March to a few months afterwards. It is the time of the year when the seals and their cubs stay on the ice where both the adult polar bears and their pups feed themselves. The polar bear is, therefore, thriving when there is sufficient ice in the spring and large areas with open water in summer and autumn.
The number of polar bears can fluctuate considerably, but there is no danger of extinction of the polar bear. 7,000 Years ago the temperature in the Arctic was 2–3 degrees warmer than now, and the sea ice area correspondingly shrunk. Still, the polar bear survived. For centuries the polar bear has adapted to an Arctic climate with great natural fluctuations in temperature and ice conditions. So, the polar bear is not an endangered animal. The biggest threat to the polar bear population is uncontrolled hunting and too much and too thick sea ice.
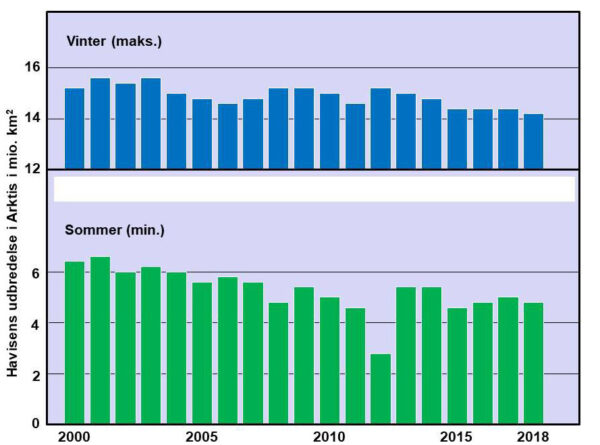
Figure 11. Sea ice distribution in the Arctic summer (September) and winter (March) during the period 2000-2018. As can be seen from the figure, sea ice has only shrunk a little during that period. Data source: National Snow and Ice Data Center (NSIDC).
Future climate?
When the amount of solar radiation and changes in the cloud cover have been the main driving forces behind climate change so far, it is most likely that this will also apply in the future. As illustrated in Figure 12, the IPCC models present a gloomy picture of future global temperature. But – as we have seen – one cannot have confidence in the IPCC climate models’ projections about the future climate. The statistical–empirical climate models, which are based on analyses of natural fluctuations back in time appear to be useful for forecasting. They project a slight decrease in global temperature after 2030 and up to 2050, after which the temperature will increase in the following 30 years to then stabilize towards the year 2100 at a level about 0.1oC above current the global temperature.
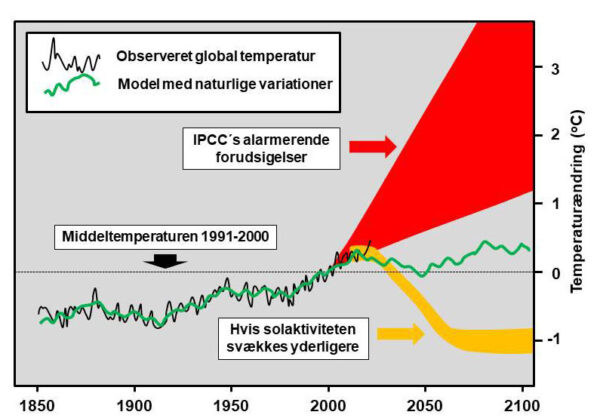
Figure 12. The change in observed global temperature in relation to the mean value for the period 1991-2000, compared with the IPCC’s alarming forecasts, partly with a statistical-empirical model constructed on the basis of natural variations in temperature, and partly with a situation with weakened solar activity. Source: J.-E. Solheim 2017.
A third scenario in Figure 12 is related to the Sun’s activity. The latest sunspot cycle (No. 23), which ended in December 2008, has been exceptionally long, namely 12.6 years – it is the longest since the Little Ice Age that ended just over 100 years ago. The previous sunspot cycle was only 9.7 years long. The researchers take the long solar cycle as an indication that the Sun has become much weaker. We have to go back to 1850 to find a sunspot cycle, where there have been as many days without sun–spots. The sun’s behavior is, therefore, unusual at the moment. The solar activity declines faster than it has done at any time since the Little Ice Age. As expected, the current solar spot cycle culminated in 2013 with a minimum maximum that was significantly less than the previous one in March 2000. Therefore, one may fear that the Sun is entering a very deep minimum, similar to Maunder Minimum in the period 1645–1715 or the so–called Dalton Minimum 1790–1820 during the Little Ice Age. A 210–year cycle is well known in the Sun’s activity. It is visible in the data series from the GISP2 ice core from the inland ice in Greenland.
Reduced sunspot activity and a longer sunspot cycle are the harbingers of a colder climate within a few years – and some scientists even believe that we might be heading towards a new Little Ice Age, which may already arrive in the middle of this century. The alternation of the current warm period and a cooler period and, in the worst case, of a new Little Ice Age, will have serious consequences for society, for agriculture, fishery and, not least, for energy consumption. But as the IPCC itself concludes in its 2001 report: ‘In climate research and modeling, we should recognize that we are dealing with a coupled non–linear chaotic system, and therefore that the long–term prediction of future climate states is not possible.’
Modern weather extremes
Why is the extreme weather perceived as something extraordinary these days, something that only happens in our lifetime? There are four main reasons for this.
First, the IPCC, politicians, news media, and school teachers have been good at indoctrinating us and a generation of children and adolescents with the notion that today’s weather is extremely extreme because of global warming and its scary effects, due to human carbon emissions. It has been easy to instill the CO2 hypothesis into the common consciousness.
Secondly, our lifestyle is based on the belief that the climate has largely been stable throughout generations, and that a stable climate is, therefore, a matter of course and even a human right, such as the UN’s former High Commissioner for Human Rights, Mary Robinson, grotesquely declared in 2009. But the climate has always been changing.
Thirdly, finite resources have to be shared by a growing population. Human settlements have expanded to places which were uninhabited before – and this has contributed to increased damage by accidents that follow in the wake of weather extremes. A storm surge of the same size as Bodil in 2013 hit Roskilde Fjord in January 1921, but without causing damage. At that time, no one lived in the areas affected by the storm surge.
Fourth, modern communication does not stop at national boundaries. From the couch in the living room at home, we may watch frightening images of events, from nearby and far–away places, of the mighty weather’s violent forces which sow death and destruction. The news media exposes us to a ‘bombardment’ of calamities that can lead us to believe that the end is nigh. It has created a climate hysteria with religious overtones. Even the former president of the IPCC, Rajendra Pachauri, wrote in an open letter to the world community on February 15, 2015: ‘For me it is not just a mission, It is a religion.
It is an alarming thought that the leader of such a powerful organization as the IPCC wants to believe rather than to know. The climate changes with extreme weather we are witnessing today, have occurred earlier and were even much worse, even in the more distant past of which meteorological records are available.
For instance, according to DMI most nationwide storms in Denmark occurred during the cold decades around 1900. And in the western Mediterranean region, rainfall has over time followed a natural cycle of about 200 years, from long periods dominated by rainy years to periods dominated by rain–poor years and drought. If one looks far enough into the past, then one will find that history repeats itself – but the IPCC does not want to do that. And one may wonder why. And the public is unaware of all this.
 Already in the 16th century, people believed that the sky was important for climate. Here, archers try to change the weather by shooting into the clouds.
Conclusion
During the debate on the defense budget in the autumn of 2017, you stated from the Folketing’s rostrum: ‘We should not ignore reality’. But in the climate area, politicians and the media consistently ignore the reality of observations and robust science. The politicians’ alibi for far–reaching political decisions, which are becoming increasingly intrusive and costly for society, are the IPCC’s ‘scientific’ conclusions and recommendations. The IPCC scandals, the many scientific errors, denials of alarming statements or the absence of correlation between the CO2 concentration and temperature – the CO2 concentration has sometimes been 5–10 times higher than now – are being ignored by the political elite. Developments reached a culmination point when politicians decided to follow the projections from climate models, which are inadequate. In the IPCC’s own professional reports it is acknowledged: ‘In climate research and modeling, we should recognize that we are dealing with a coupled non-linear chaotic system, and therefore that the long–term prediction of future climate states is not possible.’
It should also be emphasized that some of the world’s leading experts in forecasting, K.C. Green & J.S. Armstrong, have pointed out that the IPCC followed only 17 of the 89 relevant principles that should be met for good forecasts (Global warming: Forecasts by scientists versus scientific forecasts. Energy & Environment 18, 7, 997-1021, 2007).
Moreover, politicians and the media cannot clearly distinguish between environment and climate. The two concepts are mixed up into one big mishmash.
We can and should do something about the environment, but climate is controlled by nature.
Thank you for your attention.
Yours sincerely
Johannes Krüger
– – –
Johannes Krüger is dr. and Professor Emeritus at the Department of Geosciences and Nature Management, University of Copenhagen. Fields of research: landscape, glaciers and climate. He is author of the book: Climate myths – a critical assessment of today’s CO2–panic [Klimamyten – et opgør med tidens CO2–panik] (People’s Press 2016).
[Private: Johannes Krüger, Københavnsvej 19 1.th., 3400 Hillerød, Tlf. 29255667, E-mail: jk@geo.ku.dk eller jk@ign.ku.dk]


Figuur 12 maakt duidelijk dat de zogenaamde sceptici zich nergens druk over hoeven te maken. De temperatuur gaat binnenkort vanzelf de gele koers volgen. Geniet van het heerlijke weer! Over een paar jaar is de klimaathype voorbij!
Je kent de geschiedenis niet. Wanen zijn uiterst hardnekkig, zeker als overheden of andere machthebbers er garen bij spinnen. Heksenverbranding is heel lang doorgegaan. Het duurde vele decennia voordat Galileo Galilei zijn gelijk kreeg. Jodenvervolging en Antisemitisme met bijbehorende Jodensprookjes zijn er zelfs nog steeds.
Massahysterie rondom klimaat, zoals nu ontketend door overheid en media is niet zo maar over.
De meeste mensen kunnen eenvoudig de feiten aflezen. http://www.realclimate.org/images//cmp_cmip5_sat_ann-2.png
Een jaar of twee afkoeling en de klimaathype is voorbij. Dat garandeer ik je. Weet je wat het probleem is Gert Visser? Er is geen afkoeling.
“Weet je wat het probleem is Gert Visser? Er is geen afkoeling.”
Ik durf te voorspellen dat de temperatuur aan het eind van deze week 11 graden lafer ligt.
Kunnen de modellen ook aangeven hoeveel de aarde opgewarmd zou zijn als er geen menselijk CO2 was geweest?
Menselijk CO2? Bedoel je nu het cremeren van dode mensen?
Nee, misschien niet. Maar het is een illusie om te denken dat wij daar enige invloed op kunnen uitoefenen. Er waren talrijke perioden waarin het globaal (veel) warmer was dan nu. Zonder AGW uiteraard. Misschien duiken we wel weer zo’n periode in. Of juist niet. Het is een illusie om te denken dat wij daar enige invloed op kunnen uitoefenen. CO2 is een uiterst zwak broeikasgas vergeleken met waterdamp. De invloed van de CO2-deken die er inmiddels zou moeten zijn merk je niet: als er in de winter een sterrenhemel is vriest het gewoon. Moet er eens wat bewolking zijn, geen vorst hoor. CO2 is een uiterst zwak broeikasgas vergeleken met waterdamp.Niets om je druk over te maken. Dat dit wel gebeurt heeft meer met geld te maken dan met oprechte zorg over het leefmilieu.
Jij zegt dat het een illusie is. Misschien is dat zo. Maar misschien ook niet. En dat er perioden waren die warmer waren in de geschiedenis van de Aarde doet niets af dat de mens invloed heeft op de hedendaagse opwarming. Het past in het rijtje: “Klimaatverandering is van alle tijden” en het “klimaat is complex.” Helmaal waar, iedereen weet het en het zegt verder niets. Bullshitbingo dus. En jij hoeft je ook helemaal niet druk te maken Gert Visser. Als CO2 een uiterst zwak broeikasgas is dan stopt de opwarming vanzelf en moet het gaan afkoelen. Dus ga maar lekker genieten van het mooie weer. Als het af gaat koelen is de klimaathype zo voorbij. Nu dus nog eventjes niet.
@ Hermie.
Progressieve toename van Co2 uitstoot correleert met wantrouwen in CAGW politici. Komende EU verkiezing wordt een grote afstraffing, in vrijwel alle EU landen.
MP waarom is die CO2 uitstoot volgens de Keeling Curve zo’n onnatuurlijke lineaire lijn; curven doet ie niet.
Ik zoek me suf naar verklaringen maar heb ze tot op heden niet gevonden.
De enige die ik weet te bedenken is dat deze ook man made is.
Las op een ander forum een reactie van iemand die 30 jaar CO2 heeft gemeten en was volgens hem al die jaren om en nabij 350 ppm.
Ik ga voor het Ceeling Curve Complot ;)
Was het trouwens niet Tyndall die betrokken was met uitvinding van de koelkast in kader koelingseffecten CO2?
@ Anne
Spectrum meting op Hawaï wordt niet meer geijkt, voorheen was er ook chemische meting welke overigens juist wel die temperatuur volgende fluctuaties laat zien.
Het is ook bijna nergens meer dan 400PPM , enkel rond de evenaar. Hoe verder naar het noorden of zuiden hoe lager de PPM wordt, wat wel verscheelt aan de hand van het seizoen. Het plakken van spectrum analyse data op Hawaï op de historische ice core data van Antarctica is dan ook bedrog.
https://i2choose.files.wordpress.com/2018/09/image-171.jpg?w=723
Misschien is onze atmosfeer wel enigszins vergelijkbaar met een koelkast.
Dank voor je antwoord MP. Vertrouw erop dat je eea hebt uitgezocht.
Desalniettemin geloof ik niet in die Keeling curve.
De oprichting van de Club van Rome loopt parallel aan de oprichting van Keeling.
De arctische en antarctische stations staan onder bevoegdheid van…
De rest laat zich raden.
@ Anne.
Dat is in ieder geval deels correct. In de hogere atmosfeer heeft co2 juist een afkoelend effect en het beschermt tegen zonne winden, volgens nieuwe NASA satelliet data.
https://youtu.be/qPXTslFe00Y?t=49
Dit is ook geldig op Antarctica, 2 recente research papers tonen aan dat meer co2 juist voor wat afkoeling zorgt in die regio, hetgeen hier gepost is gisteren.
MP, waar ik naar toe wil is de corrupte Keeling curve.
Zonder dat valt het hele kaartenhuis uiteen.
@ Anne. de co2 Keeling curve laat het adem proces tussen de oceaan en de atmosfeer zien wanneer je kijkt naar dag data (zig zag dag nacht patroon). En ze laten het adem proces ook zien op seizoen basis (zig zag tussen zomer en winter)
https://media.treehugger.com/assets/images/2013/05/mauna-loa-C02-ppm-full_record.png.860x0_q70_crop-scale.png
Het niets aantrekken van andere grotere natuurlijke oscillaties is inderdaad verdacht. We zouden ook het adem proces van die processen moeten zien.
MP, het ademproces is me wel duidelijk. Zo zie ik het ook. Wij ademen in en uit; de aarde in al zijn hoedanigheid ademt in en uit. God ademt in en uit.
Het gaat om de menselijke vertekening en bedrog; inclusief de wetenschappers, die het willen keren naar het niveau van de zichzelf afgeroepen meerderen van deze planeet die weten hoe ons universum inclusief onszelf in elkaar zitten. Arrogantie lijkt me.
Nogmaals, de Keeling curve is bedrog. Hoe kunnen we dit bedrog en ander bedrog aan de kaak stellen?
Vanuit de theoretische wetenschap zoals reeds aangegeven. De curve volgt alle temperatuur gerelateerde adem processen op dag en seizoen niveau, maar niet het effect van de overige oscillaties. Hetgeen de betreffende lange termijn curve diskwalificeert.
Voel vrij om daar meer aan toe te voegen.
Vanuit de praktijk is concurrerende metingen de enige oplossing, empirisch ijken van huidig stellingen. Dat kan op centraal niveau en decentraal met vele mensen welke allemaal meten.
Volgens Hermie willen de sceptici vrouwtje Vattenfall op de brandstapel gooien. Of deze verdachtmaking ook de zogenaamde sceptici geldt is nog niet helemaal duidelijk.
Dat is dan precies zo als ze met Baudet aan het doen zijn, overal zijn ze hem tot op het bot aan het afkraken en slecht maken.
Waarom? Angst.
Het begint er op te lijken dat wereldwijd steeds meer wetenschappers zich met de klimaatzwendel gaan bemoeien. Het zal keer tijd worden dat er ook eens wat gezond verstand ingezet gaat worden.
Dan kan ik alleen maar constateren dat je in de verkeerde hoek zit, ‘Verwarde’ Guido, die nick heb ik namelijk nog niet gezien van jou.
Als een narcist beschuldigd wordt van narcisme, kan hij twee reacties geven: 1. Ontkennen en boos worden, 2. bekennen en er trots op zijn. Als je iemand beschuldigd van het zijn van een narcist en zijn/haar vraag is ‘waarom denk je dat?’, is de uitslag eenvoudig. Die is dan namelijk geen narcist.
Fake Guido is gezien zijn reacties een narcist. Discussiëren met hem is zinloos.
Het meest bizarre van dit alles is dat het helemaal niet uit maakt of de mensheid de aarde nu wel of niet opwarmt door CO2 uitstoot.
De manier waarop wij nu de grondstoffen van onze planeet verbruiken en het letterlijk kaalvreten van de planeet door 7,8 miljard mensen -met een toename van 80 miljoen per jaar- nadert zijn einde. Wat niemand kan voorspellen is of dat dit einde binnenkort komt of dat het nog vrij lang gaat duren. Verder heeft de mensheid altijd geniale breinen die iets weten te bedenken waardoor we weer een tijdje verder kunnen.
De klimaat discussie is een politieke. Gevoerd door personen die geen kennis hebben van de inhoud en dat ook niet willen hebben. Personen die uitsluitend worden gedreven door sektarisch eigenbelang en die geen enkele leugen schuwen om anders denkenden in de stront te trappen.
Dat brengt mij bij het grootste probleem van de Westerse beschaving. Het grote aantal mensen die de welvaart wel consumeren maar er geen bijdrage aan leveren. Variërend van de kakkers op de golfbaan tot de zuipschuiten in het denksportcentrum. Mensen die neerkijken of afgeven op degenen die alle arbeid verrichten met als doel op degenen die alle arbeid verrichten te parasiteren.
Mee eens!
De “duurzame” gekte van het sluiten van moderne schone kolencentrales, “van het (aard-)gas los”, elektrische auto’s, accu’s, windmolens en zonnepanelen versnellen het opraken van grondstoffen, mineralen en zeldzame aardmetalen. Het is slopen de natuur en het ernstig vervuilen van het milieu elders op de wereld..
Het is de ideologische waan van het “klimaat te redden” door de kortzichtigheid (myopie) voor het vernietigen van de aarde, Hijkoop!
Oneindige groei in een eindige wereld… Dat moet ooit ergens fout gaan. De wal zal het schip keren.
Kwalitatieve groei kan in principe oneindig doorgaan.
ja. ja.
Het klimaat verandert.
Het wordt kouder.
https://documentcloud.adobe.com/link/track?uri=urn:aaid:scds:US:42f86fb5-bd3a-4bce-a1d2-2e33fe3fa66b
(onderzoek van mij in 2015, sluit alle resultaten in van 2014)
Nee, het wordt niet kouder. Het warmt nog steeds op. Het is inmiddels 2019. Alle bronnen laten zien dat het globaal opwarmt. http://www.realclimate.org/images//cmp_cmip5_sat_ann-2.png
Hoi HenryP,
Leuk, zo’n eigen studie, complimenten daarvoor (ondanks dat het nu met 5 jaar is gedateerd). Maar je tabellen laten toch overwegend zien dat het warmer werd? Daarnaast, er is natuurlijk wat af te dingen op uw methode, door elke meting evenveel gewicht mee te nemen. Ik kan me goed voorstellen dat er betere methodes zijn om tot een globaal gemiddelde temperatuur te komen, en dat deze analyse niet perse een juist beeld geeft van de trend in globale temperatuur. Of denkt u van wel? Hoe dan ook, hoezo concludeert u een temperatuurdaling op basis van uw analyse? En daarnaast, hoe kijkt u naar het plaatje van Hernie van tijdsreeksen van de globale temperatuur op basis van tijdreeksen die door wetenschappelijke instituten zijn geassimileerd (die overigens allemaal redelijk consistent zijn met elkaar)? Het grappige is overigens dat de in de tabel door u geconcludeerde stijging van ~0.01 graden per jaar van de globale gemiddelde temperatuur niet eens zo ver af zit van de tijdsreeksen die Hermie laat zien. Daar zie ik zo snel een stijging van ~0.4-0.8 graden over de laatste 40 jaar (0.01-0.02 graden per jaar). Ook interessant is dat u laat zien dat de maxima sterker stijgen dan de gemiddelde temperatuur, iets wat ook redelijk in lijn is met wetenschappelijk rapporten. Aldus, mijn complimenten voor uw huis-analyse (aangenomen dat u zelf geen publicerend wetenschapper in dit veld bent). Enkel is uw conclusie enigszins in contrast met uw eigen resultaten, of ziet u dat anders?
Groeten, Jan
Jan, bedankt voor jouw reactie.
Je moet even mijn methode begrijpen. Ten eerste maak ik natuurlijk zeker dat ik alle dagelijkse resulaten van het weer station heb en zet dit om in een gemiddelde jaar temperatuur voor elk jaar terug naar 1976. Daar is een speciale procedure te volgen voor enkele dagen zonder resulaten.
Ik deed dan 4 regressies over 4 perioden van tijd. Ik kijk naar de afgeleides van de lineaire regressie vergelijkingen. Dat zijn dus alle zwarte getallen in de tabellen. Dat geeft mij over 4 periodes de gemiddelde spoed van verwarming (+) of verkoeling (-) in K/jaar bij elk station. Daarna neem ik alle gemiddeldes en zet ik deze 4 waardes uit tegen tijd; ik vind de passende vergelijking met de hoogste correlatie. Dan kan je in de grafiek de versnelling zien in K/jaar2. Om de grafieken te lezen en te begrijpen wat je ziet, moet je ze wel van rechts naar links lezen. Nul is dus het jaar van de waarneming, namelijk 2015, helemaal links.
Om te beginnen zien we een duidelijke afname in de snelheid van Tmax in K/jaar. Dan komt dan inderdaad niet zozeer omdat de zon kouder wordt maar wel omdat ozon & peroxide & ander bezig zijn om te stijgen,
bv.
https://i2.wp.com/oi61.tinypic.com/ju7fw9.jpg
(Dat heeft weer te maken met de afname van de veld sterktes op de zon).
Het eigenaardige was dat ik bij mijn grafiek van Tmin (helemaal onderaan) een correlatie kreeg van 100%. Dit laat dus geen ruimte voor enige mens gemaakte verwarming……
Alles is natuurlijk. De grafiek laat ook precies ongeveer de helft zien van de Gb cycle die 87 jaar is en je kan dus makkelijk raden dat die hele relatie een sinusoide is.
Het wordt dus kouder. Globaal.
Maar dit betekent nog niet dat jullie daar in NL iets van zullen voelen. Bij jullie en USA gaat het warmer en droger worden, vooral in de zomers. De Dust Bowl droogte van 1932-1939 was een van de grootste droogtes in de geschiedenis van Amerika. Begrijp je waarom het droger zal worden op de hogere breedte graden? ?
Ik heb inderdaad wel een speciale bemonsterings procedure gevolgd en die moet je ook nog wel goed begrijpen. Dat is weer een ander verhaal. Maar mijn bemonstering was wel 100% random, natuurlijk.
De ander bronnen die die je noemt denken dat je juist heel veel weer stationnen moet bekijken en dan hebben ze bv 4000 in het NH en 400 in ZH en dan gooien ze alles op een of twee hopen en ze menen dan dat ze daauit een ‘globaal’ gemiddelde kunnen krijgen. Dat werkt dus niet. De satellieten hebben ook een aantal problemen, bv. calibratie, vooral nou, met de zon die meer van de meest energieke deeltjes spuugt.
Hoi HenryP
De stap ” Daarna neem ik alle gemiddeldes en zet ik deze 4 waardes uit tegen tijd” is incorrect. Daarmee onderzoekt u of de trend afneemt als u kortere periodes neemt van vóór 2014. Dat is helemaal niet interessant, want korte periodes zijn niet geschikt voor de trend analyse. Interressant zijn enkel de trends zelf, en dan vooral de trends die bepaald zijn over periodes die groot genoeg zijn om de grilligheid van het klimaat uit te middelen. De trends in de trends naar het nemen van kortere periodes slaat nergens op… Wanneer u de analyses opnieuw uitvoert met recentere data zullen die lange periode trends niet veel zijn verandert, maar die korte periode trends wel degelijk. Die korte periode trends zijn immers niet robuust (omdat het trends zijn over een korte periode…).
Er is geen afname in Tmax per jaar, immers is de trend van Tmax positief. U vindt een afname in de trend van Tmax per jaar over steeds kortere periodes van vóór 2014. Maar dat zegt niet dat Tmax daalt, die is nog steeds stijgend, aangezien de trend nog steeds positief is. Overigens is die afname van de trend over steeds kortere periodes wederom niet interessant, want die korte periodes zijn niet geschikt voor trend-analyse. Dat is wederom iets wat compleet zou veranderen wanneer u de analyse met huidige data zou uitvoeren.
Vervolgens komt u met zonsterkte en ozon/peroxide, Daar hadden we het helemaal niet over… Het gaat erom dat u trends vind van ~+0.01C per jaar, over periodes van 30 a 40 jaar vóór 2014. Dat is dus een stijging in de temperatuur, niet een daling.
Een correlatie van 100% is niet zo moeilijk te verkrijgen als de hoeveelheid datapunten maar met 1 de hoeveelheid fit-parameters overstijgt. Als u een datapunt minder neemt dan geven al uw kwadratische fits 100% correlatie aan. Dat heeft niets met invloed van de mens te maken. Dat u precies een trend in de trend over steeds kortere periodes kan fitten met een kwadratische formule zegt helemaal niets over de oorzaak van de trend in de trend over steeds kortere periodes, noch in de oorzaak van de trend zelf… Maar waarom zou u uberhaupt een trend in de trend over steeds kortere periodes willen bepalen?
Jan
Deze discussie kan interessant worden. Je begrijpt mijn methode nog niet of je wil het liever niet begrijpen omdat ik zeg dat de klimaat verandering door globale verkoeling veroorzaakt wordt. Het heeft inderdaad soms tijd nodig om totaal ingeprente ideeen te veranderen…
je zegt:
Er is geen afname in Tmax per jaar, immers is de trend van Tmax positief. U vindt een afname in de trend van Tmax per jaar over steeds kortere periodes van vóór 2014. Maar dat zegt niet dat Tmax daalt, die is nog steeds stijgend, aangezien de trend nog steeds positief is.
maar ik zeg:
Over de langste periode is de trend positief nml. 0.034K/jaar. Over de kortste periode is het negatief, nml. ca -0.01K per jaar.
Het gaat hier over gemiddelde afwijkings van het gemiddelde. Als ik nou regressie zou doen over alle weer stations van 1990 tot 1976, wat zou mijn resultaat dan zijn?
Snap je dat het veel hoger zou zijn als die 0.034 K/jaar?
Inderdaad, als mijn periode van regressie minder als tenminste een (halve) zon ciklus zou zijn (Schwabe) , heb je een punt beet. Maar dat is dus niet zo.
Ik kan mijn onderzoek uitbreiden om de laatste 4 jaar ook in te sluiten. Dat levert mij een aantal problemen op. Namelijk, er is geen mensgemaakte warmte. Ik kan al mijn huidige resultaten precies correleren met wat op de zon gebeurt. Tmax was bij een dead-end stop in 2014. Dus van toen af gaat de spoed van temperatuur weer omhoog.
Beste HernyP,
Er zijn een aantal dingen die niet kloppen aan u redenering.
U schrijft: “Als ik nou regressie zou doen over alle weer stations van 1990 tot 1976, wat zou mijn resultaat dan zijn?,Snap je dat het veel hoger zou zijn als die 0.034 K/jaar?” Ja dat klopt. Maar dat is niet interressant, omdat u dan een periode neemt van 14 jaar, die is te kort en het resultaat daarom te grillig. Het is niet gek dat een trend over verschillende periodes van 14 jaar dan weer negatief, dan weer positief kunnen uitvallen. U kunt inderdaad ook trends bepalen over allerlei periodes van 4 jaar, die zullen nog sterker varieren van soms sterk positief naar soms enigszins negatief. Maar dat heeft niets te maken met de trend in het klimaat (die over 30-40 jaar wordt gerekend). Voor trends over het klimaat is het noodzakelijk om langere tijdsreeksen te nemen. Waarom voert u dezelfde analyse niet uit op nieuwe data, nu 5 jaar later? U zult zien dat die trend over de laatste 14 jaar sterk is verandert ten opzichte van uw resultaat, maar die van 30-40 jaar minder. Doet u dat eens, en dan praten we weer verder.
U schrijft: “er is geen mensgemaakte warmte. Ik kan al mijn huidige resultaten precies correleren met wat op de zon gebeurt.” Waar concludeert u dat op, deze analyse geeft geen oorzaak. U voert in uw tabel helemaal geen regressie uit van temperatuur naar physische variabelen. Er is geen reden aan te nemen dat de oorzaak van de trends wel door de zon komen en niet door CO2. U bepaald enkel de trend in de trend naar het nemen van kortere periodes. Dat u dat kan fitten met een kwadratische formule bewijst helemaal niets.
U schrijft: “Ik kan mijn onderzoek uitbreiden om de laatste 4 jaar ook in te sluiten. Dat levert mij een aantal problemen op, …., Tmax was bij een dead-end stop in 2014. Dus van toen af gaat de spoed van temperatuur weer omhoog.” Het levert u problemen op dat de spoed van temperatuur weer omhoog gaat? Even in normaal nederlands, bedoeld u dat de trend in de trend naar het nemen van kortere periodes dan eigenlijk positief is in plaat van negatief. En dat is uw probleem? Weet u wat, laat u eens die data zien met de laatste 4 jaar meegenomen. Met precies dezelfde analyse. Post u die hier weer, en dan praten we verder.
U heeft ook nog niet beantwoord: Hoe rijmt u uw conclusie met de tijdsreeksen die door wetenschappelijke instituten zijn geassimileerd, zoals die laten zien door Hermie hierboven? Die tijdsreeksen worden veel nauwkeuriger geassimileerd, door meer bronnen mee te nemen, en te corrigeren voor de ruimtelijke verdeling van de metingen, en nog veel andere details. Nogmaals, de geobserveerde trend komen enigszins overeen met diegene die u vind over langere tijdsperiodes. U zult toch niet kunnen concluderen dat de temperatuur daalt op basis van die data? En naar ik lees van uw laatste stukje, ook niet van uw eigen geupdate data. Waar dat door komt is een ander verhaal, maar U zei dat temperatuur daalt. Moet u dat niet wijzigen naar “OK, de temperatuur stijgt toch, maar Ik denk niet dat het door de mens komt, ik denk dat het door de zon komt?”
Jan
Ik zei reeds eerder:
‘De ander bronnen die je noemt denken dat je juist heel veel weer stationnen moet bekijken en dan hebben ze bv 4000 in het NH en 400 in ZH en dan gooien ze alles op een of twee hopen en ze menen dan dat ze daauit een ‘globaal’ gemiddelde kunnen krijgen. Dat werkt dus niet. Het is onzin wat ze verkopen. De satellieten hebben ook een aantal problemen, bv. calibratie, vooral nou, met de zon die meer van de meest energieke deeltjes spuugt. Dus die vertrouw ook al niet meer zo heel veel.
https://wattsupwiththat.com/2019/04/25/uah-rss-noaa-uw-which-satellite-dataset-should-we-believe/
Mijn methode werkt omdat ik een speciale bemonsterings procedure gebruik en ik kijk naar verandering.
Als je ge-interesseerd bent om naar klimaatsverandering te kijken, zoals ik was, moet je toch kijken naar de verandering van de spoed van de verwarming / verkoeling in K/jaar. Hoe loopt die curve, als je dit uitzet tegen tijd? Ik vond het nogal heel merkwaardig om te zien dat ik hele grote correlatie kreeg op de kwadratische functies. Het leek net of iemand my een bal gooide en ik hoefde alleen maar het traject te berekenen. Met 4 punten kan ik inderdaad wel het verloop van een functie bepalen. Dat weet je toch wel? Als de correlatie hoog kun je een statistische toets doen om te kijken of de correlatie betekenisvol is.
Statistiek is waarschijnlijk niet je sterkste punt? Jammer.
Het zijn ook echt niet nat. log – of kwadratische functies. Ik gebruikte deze omdat het makkelijk is in excel. Het zijn natuurlijk allemaal sinoides. De golflengte is 86.5 jaar. Dat betekent dat er draaipunten zijn. Dat die draaipunten bestaan wisten ze vroeger al, voordat ze met de CO2 onzin zijn begonnen.
bv. William Arnold’s report (ik zal even kijken of ik het nog kan vinden)
Hier is dat report.
http://cyclesresearchinstitute.org/pdf/cycles-astronomy/arnold_theory_order.pdf
het is natuurlijk oud maar het heeft mij wel geholpen om in de goede richting te zoeken.
http://iie.fing.edu.uy/simsee/biblioteca/CICLO_SOLAR_PeristykhDamon03-Gleissbergin14C.pdf
ik bereken GB huidiglijk op 86.5 jaar als ik kijk naar de veldsterkten op de zon
@Jan
William Arnold maakte in 1985 een fout in zijn voorspelling van een draaipunt in 1990. Ik kon van mijn eerste functie (Tmax) makkelijk berekenen dat het bovenste draaipunt van de sinusoide bij 1994.5 was, zeg maar 1995.
De correlatie met de stand van planeten die hij voorspelde, kon ik wel makkelijk vinden.
http://oi64.tinypic.com/5yxjyu.jpg
dat het bovenste draaipunt van de sinusoide bij 1994.5 was, zeg maar 1995.
SORRY , moet wezen
dat het draaipunt van positief naar negatief bij 1994.5 was, zeg maar 1995. f(0)
(het bovenste draaipunt ligt bij 1971/1972)
HenryP,
Het spijt, maar u verkoopt hier werkelijk de grootste onzin. Dat moet u toch zelf ook wel inzien?
Natuurlijk kunt u een kwadratische functie fitten. u kunt ook een linearie functie fitten, of van mijn part een sinus/ imaginaire functie/ 6e graads polynoom, exponentiele functie/ logaritmische functie, U zoekt het maar uit. Maar dat heet niets te maken met de oorzaak van de temperatuurstijging. Daarnaast, daar ging de discussie niet over, die ging over OF er een temperatuurstijging is. Daarvoor is een kwadratische functie allerminst geschikt, die is in zijn linkerlimiet altijd stijgend, en in de rechterlimiet altijd dalend… En u fit het niet door de temperatuurmetingen, maar door de trends over temperatuurmetingen over verschillende periodes. Wat is daar dan nog de betekenis van?, noppes….
U schrijft: “Als je ge-interesseerd bent om naar klimaatsverandering te kijken, zoals ik was, moet je toch kijken naar de verandering van de spoed van de verwarming / verkoeling in K/jaar. ” Nee, als u geinterresserd bent in de verandering van temperatuur in de tijd (U schreef immers dat de temperatuur stijgt), dan dient u te kijken naar de verandering van temperatuur in de tijd. En als u geinterresserd bent in de verandering van de temperatuur in de tijd in de zin van klimaatverandering, dan dient u te kijken naar de verandering van temperatuur over een tijdsperiode van grofweg 30 tot 40 jaar. Zo moeilijk is dat niet. Sterker nog, u heeft dat ook gedaan, en daar komt een temperatuurstijging uit naar voren. Daarmee basta.
Jan. Je snapt niks van statistiek. Dus je blijft zitten in mijn klas.
Ik heb alles begrepen van klimaatsverandering en hoef niks meer te meten.
Tot ziens zullen we maar zeggen.
Dit is werkelijk de meest bizarre discussie die ik heb meegemaakt. HenryP bepaald de trend van temperatuur in de tijd over periodes van 30-40 jaar (de linkerkolomen van zijn tabellen). Al is de methode een enigszins huis-analyse, en mist deze de geavanceerde methodiek van state-of-the-art assimilatie van verschillende databronnen die in wetenschap wordt uitgevoerd, kan men op deze manier een redelijk zicht krijgen of de temperatuur stijgt of daalt. Zijn cijfers laten zien dat de trends van temperatuur over tijdsperiodes van 30 tot 40 jaar positief zijn (linkerkolomen van zijn tabellen). Echter concludeert hij daaruit dat de temperatuur met zekerheid daalt. En dan zegt hij dat ik niets snap van statistiek…
Heeft niemand anders hier een mening over? Dit kan men toch niet serieus nemen? Zelfs als je een ‘klimaatscepticus’ bent, dit kan je toch niet verdedigen? Niemand? Als men twijfels heeft over de kwaliteit van data, OK, als men twijfels heeft over of CO2 dominant in in zijn invloed op temperatuur, OK, maar een positieve trend laten zien, maar vervolgens interpreteren als een negatieve… Dat is als ‘nee’ zeggen als er letterlijk ‘ja’ staat… Dat is als zeggen dat 3 groter is dan 5, En iedereen vind dat hier maar best?
Jan, ik vind het al bijzonder knap dat je het zolang hebt volgehouden. Eerlijk gezegd heb ik de discussie niet tot in de details gevolgd, maar als iemand bij aanvang van de discussie beweert dat het afkoelt en dat met hand en tand verdedigd, terwijl alle officiële cijfers onmiskenbaar aangeven dat het opwarmt, dan denk ik: “laat lekker gaan, die HenryP”. Hij is lekker aan het rekenen, bereikt er niets mee maar doet verder geen vlieg kwaad. Prima toch?
Nee Jan. Er is hier jammer genoeg niemand die het snapt. Je bent blijven zitten….
Als ik nou een bal naar jou gooi dan is er in het begin een versnelling en als de bal op het hoogste punt was geweest dan begint er een vertraging. Als ik spoed in m/s uitzet tegen tyd in s krijg ik de versnelling. Een kwadratische functie.
Net zo hier. Ik zet K/jaar uit tegen tijd in jaren.
In feite kijk ik naar net de halve sinusoide maar ik laat dit gerieflijkheids halve even zien als een kwadratische functie.
Hoe weet ik dat mijn functie een
halve sinusoide is?
Dat is duidelijk van mijn studie van de zon. Weer een heel ander verhaal.
Het wordt dus kouder..
Maar gelukkig is alles goed gegaan met de switch in 2014 op de bodem van de sinusoide. Vanaf 2037 zal het weer warmer worden.
Maar aan de droogten op de hogere breedte graad agv vd klimaatsverandering / verkoeling kan ik niets doen. Europa heeft veel natuurlijk water in reserve maar in de USA is het een ander verhaal.
HenryP,
Je bepaalt iets wat je met enige fantasie zou kunnen interpreteren als de versnelling/vertraging van temperatuurstijging. Jou eindresultaat is niet de temperatuurstijging/daling zelf. Dat zijn je tussenresultaten over 30-40 jaar. En die zijn allemaal positief. Daarnaast is die methode die je gebruikt niet geschikt om een versnelling/vertraging in de temperatuurstijging te vinden, omdat je laatste waardes gebaseerd zijn op een te korte periode van 14 jaar. Je zou data van 30-40 jaar moeten gebruiken, en die gehele periode opschuiven om tot vertraging/versnelling van temperatuurstijging te bepalen (i.p.v. steeds kortere periode te nemen). Hoe dan ook, je houd een temperatuurstijging. Maar misschien zou je op een subtiele vertraging van de temperatuurstijging uitkomen voor het schuiven van slechts enkele jaren. Dat is opzich niet gek. Dat verandert wel weer als je een paar jaartjes wacht of met nieuwe data werkt.
Ik zit niet in uw klas.